THA is home to a workforce of dedicated staff who carry forward the mission of serving the greater Tacoma community and delivering high-quality, affordable housing for those most in need.
THA Staff at a Glance
179 total THA staff
5.8 years average tenure
3.2 years median tenure
13.3% annual turnover
THA is continuing to make strides to be a great place to work. In a 2023 survey, staff gave THA a rating of 4.15 out of 5.
Staff Demographics
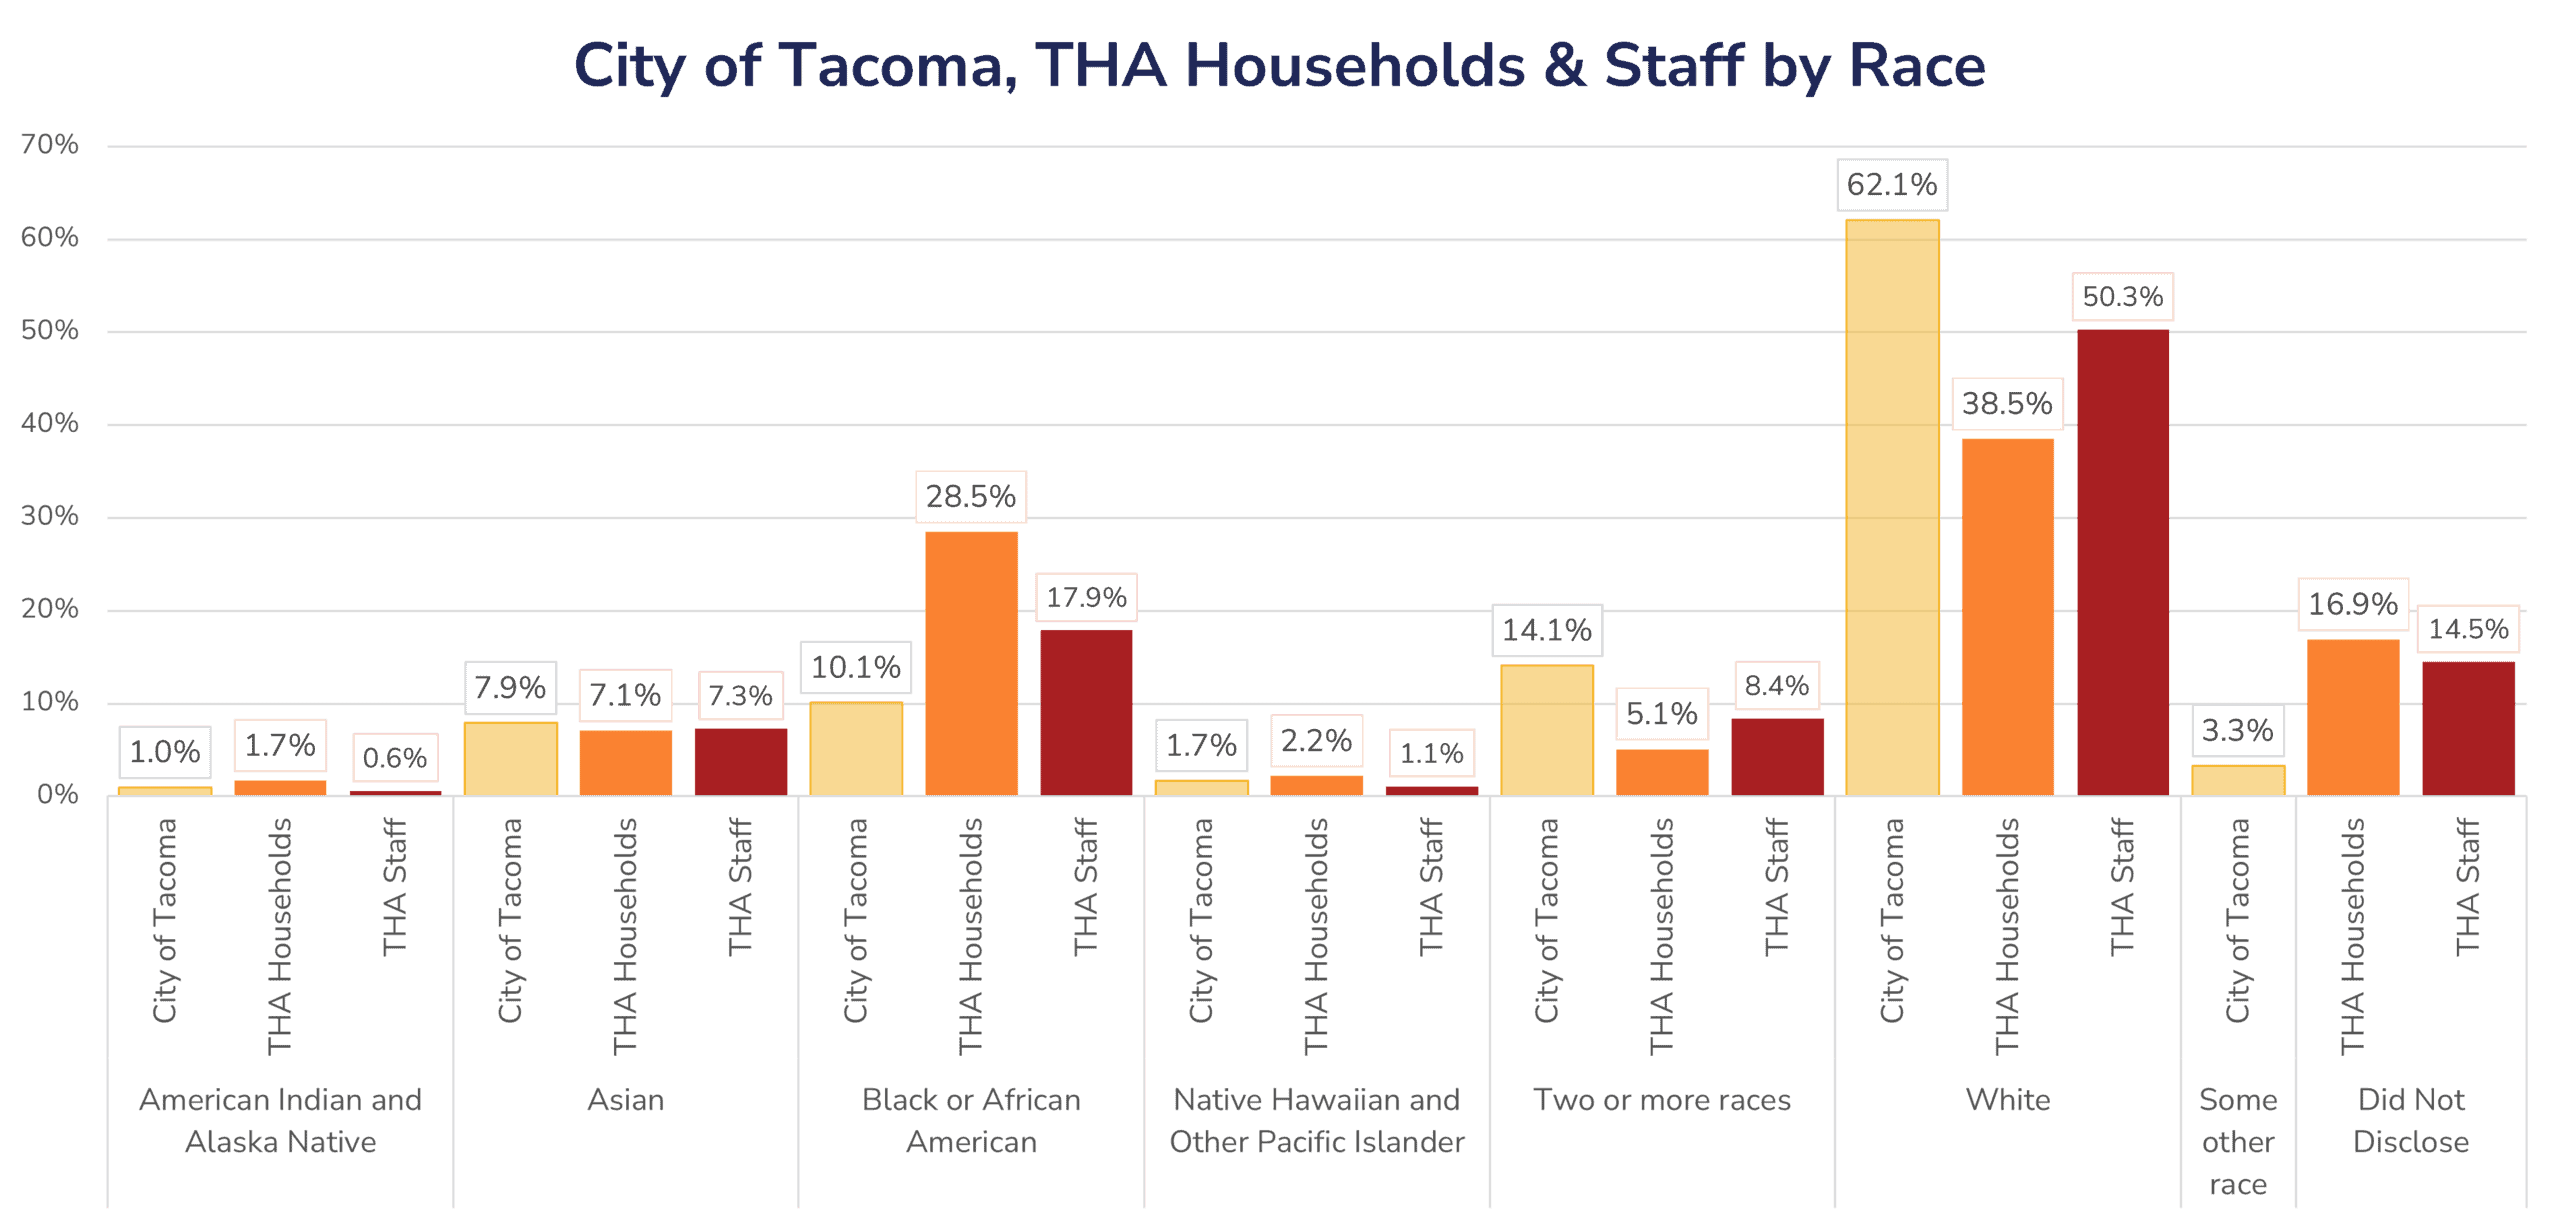
Race
City of Tacoma
THA Households
THA Staff
American Indian and Alaska Native
1.0%
1.7%
0.6%
Asian
7.9%
7.1%
7.3%
Black or African American
10.1%
28.5%
17.9%
Native Hawaiian and Other Pacific Islander
1.7%
2.2%
1.1%
Two or more races
14.1%
5.1%
8.4%
White
62.1%
38.5%
50.3%
Some other race
3.3%
—
—
Did Not Disclose
—
16.9%
14.5%
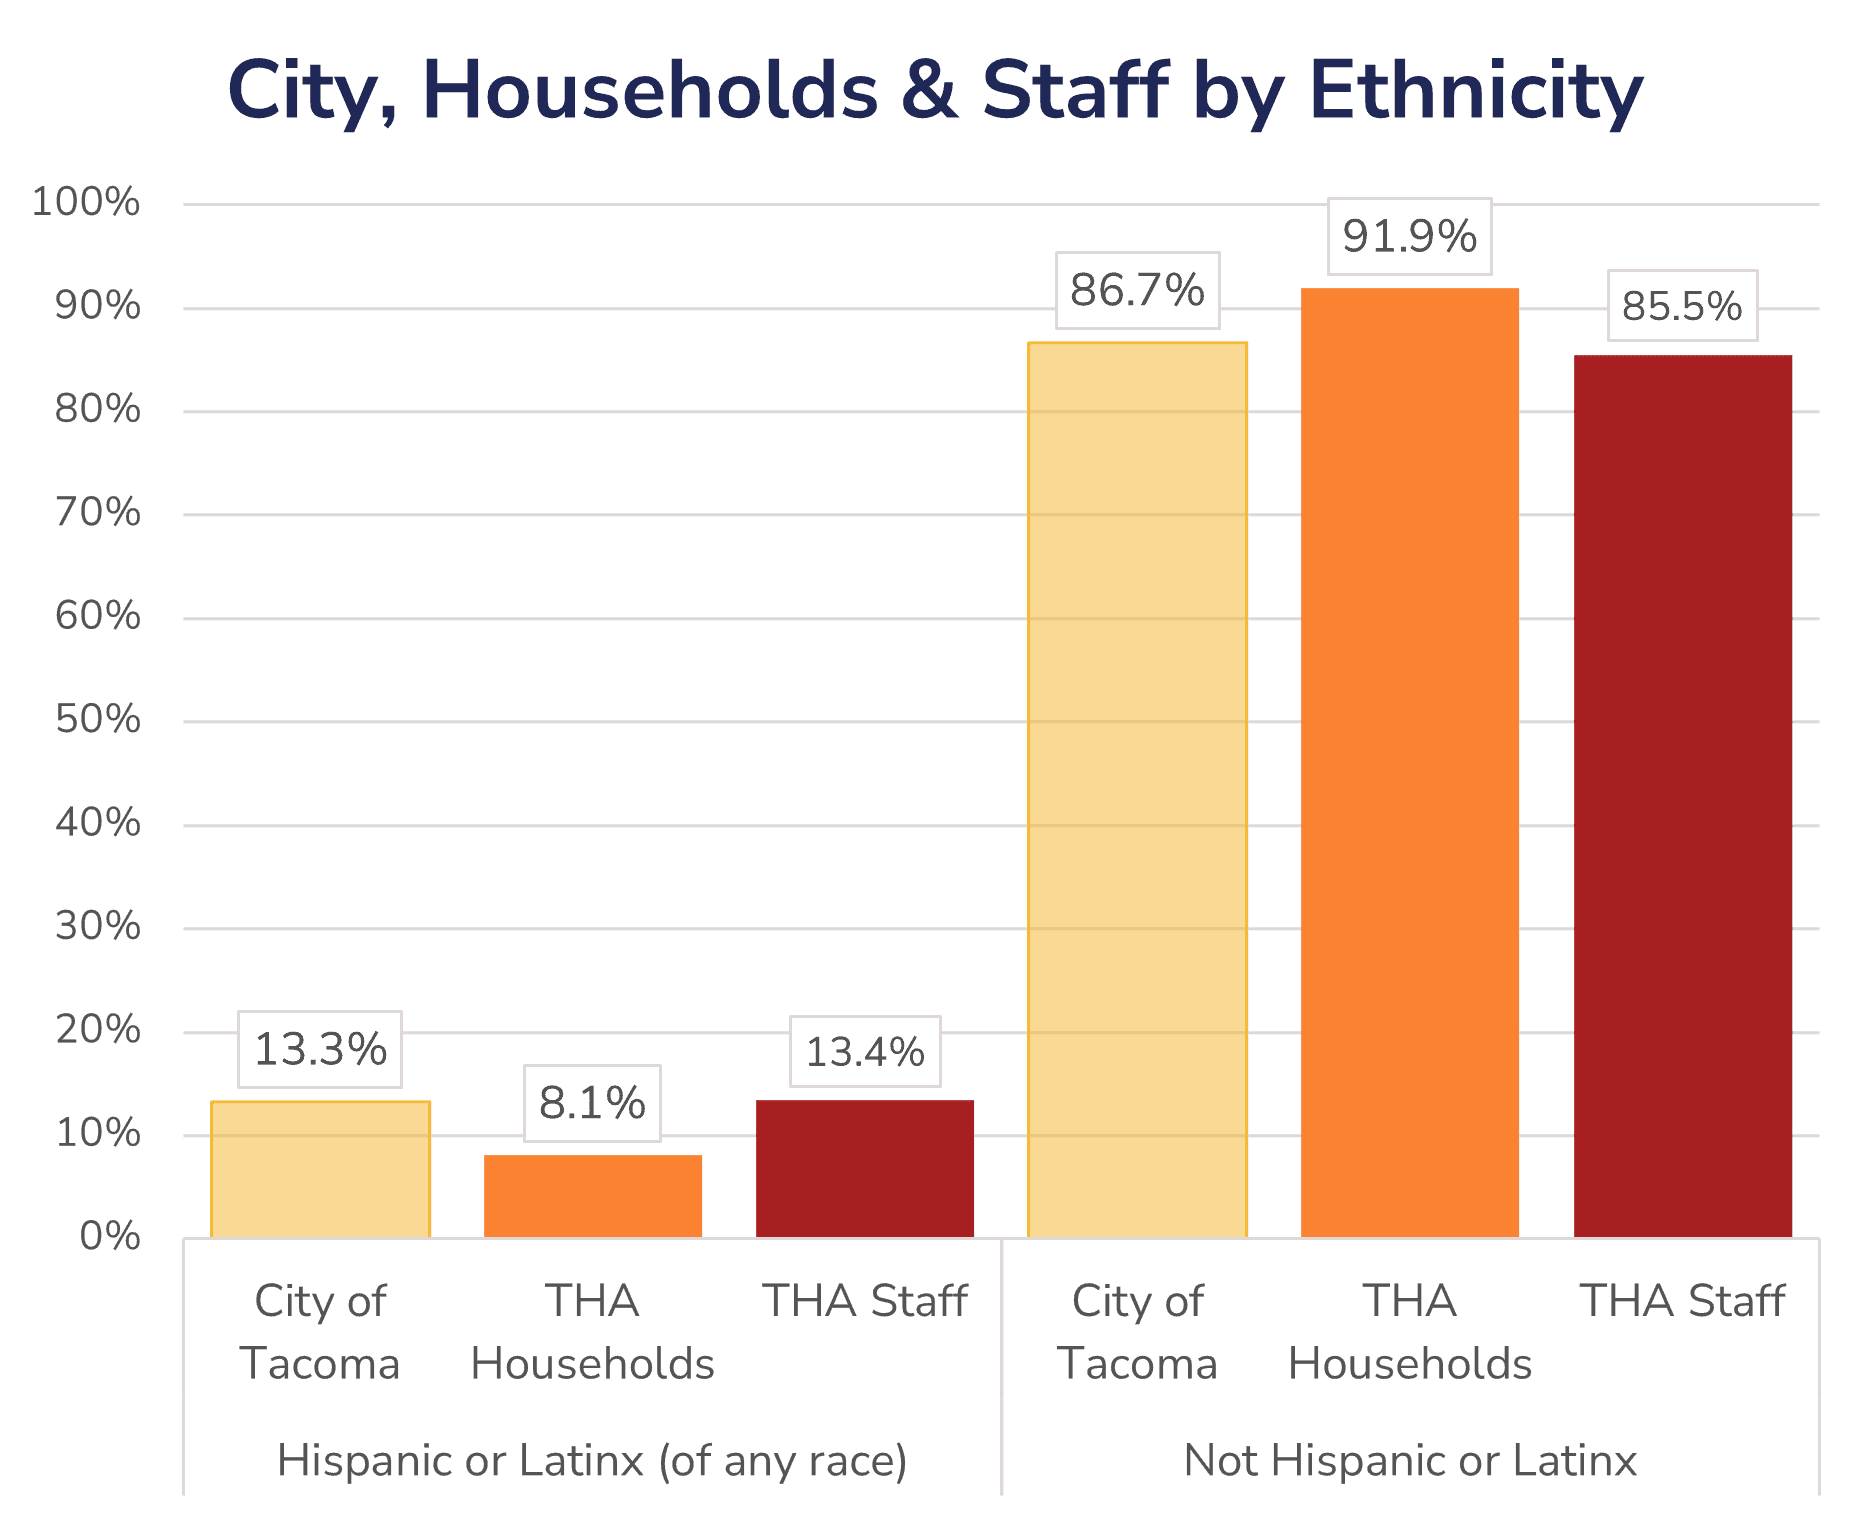
Ethnicity
City of Tacoma
THA Households
THA Staff
Hispanic or Latinx (of any race)
13.3%
8.1%
13.4%
Not Hispanic or Latinx
86.7%
91.9%
85.5%
City of Tacoma data from the 2022 American Community Survey. THA data as of December 2023.
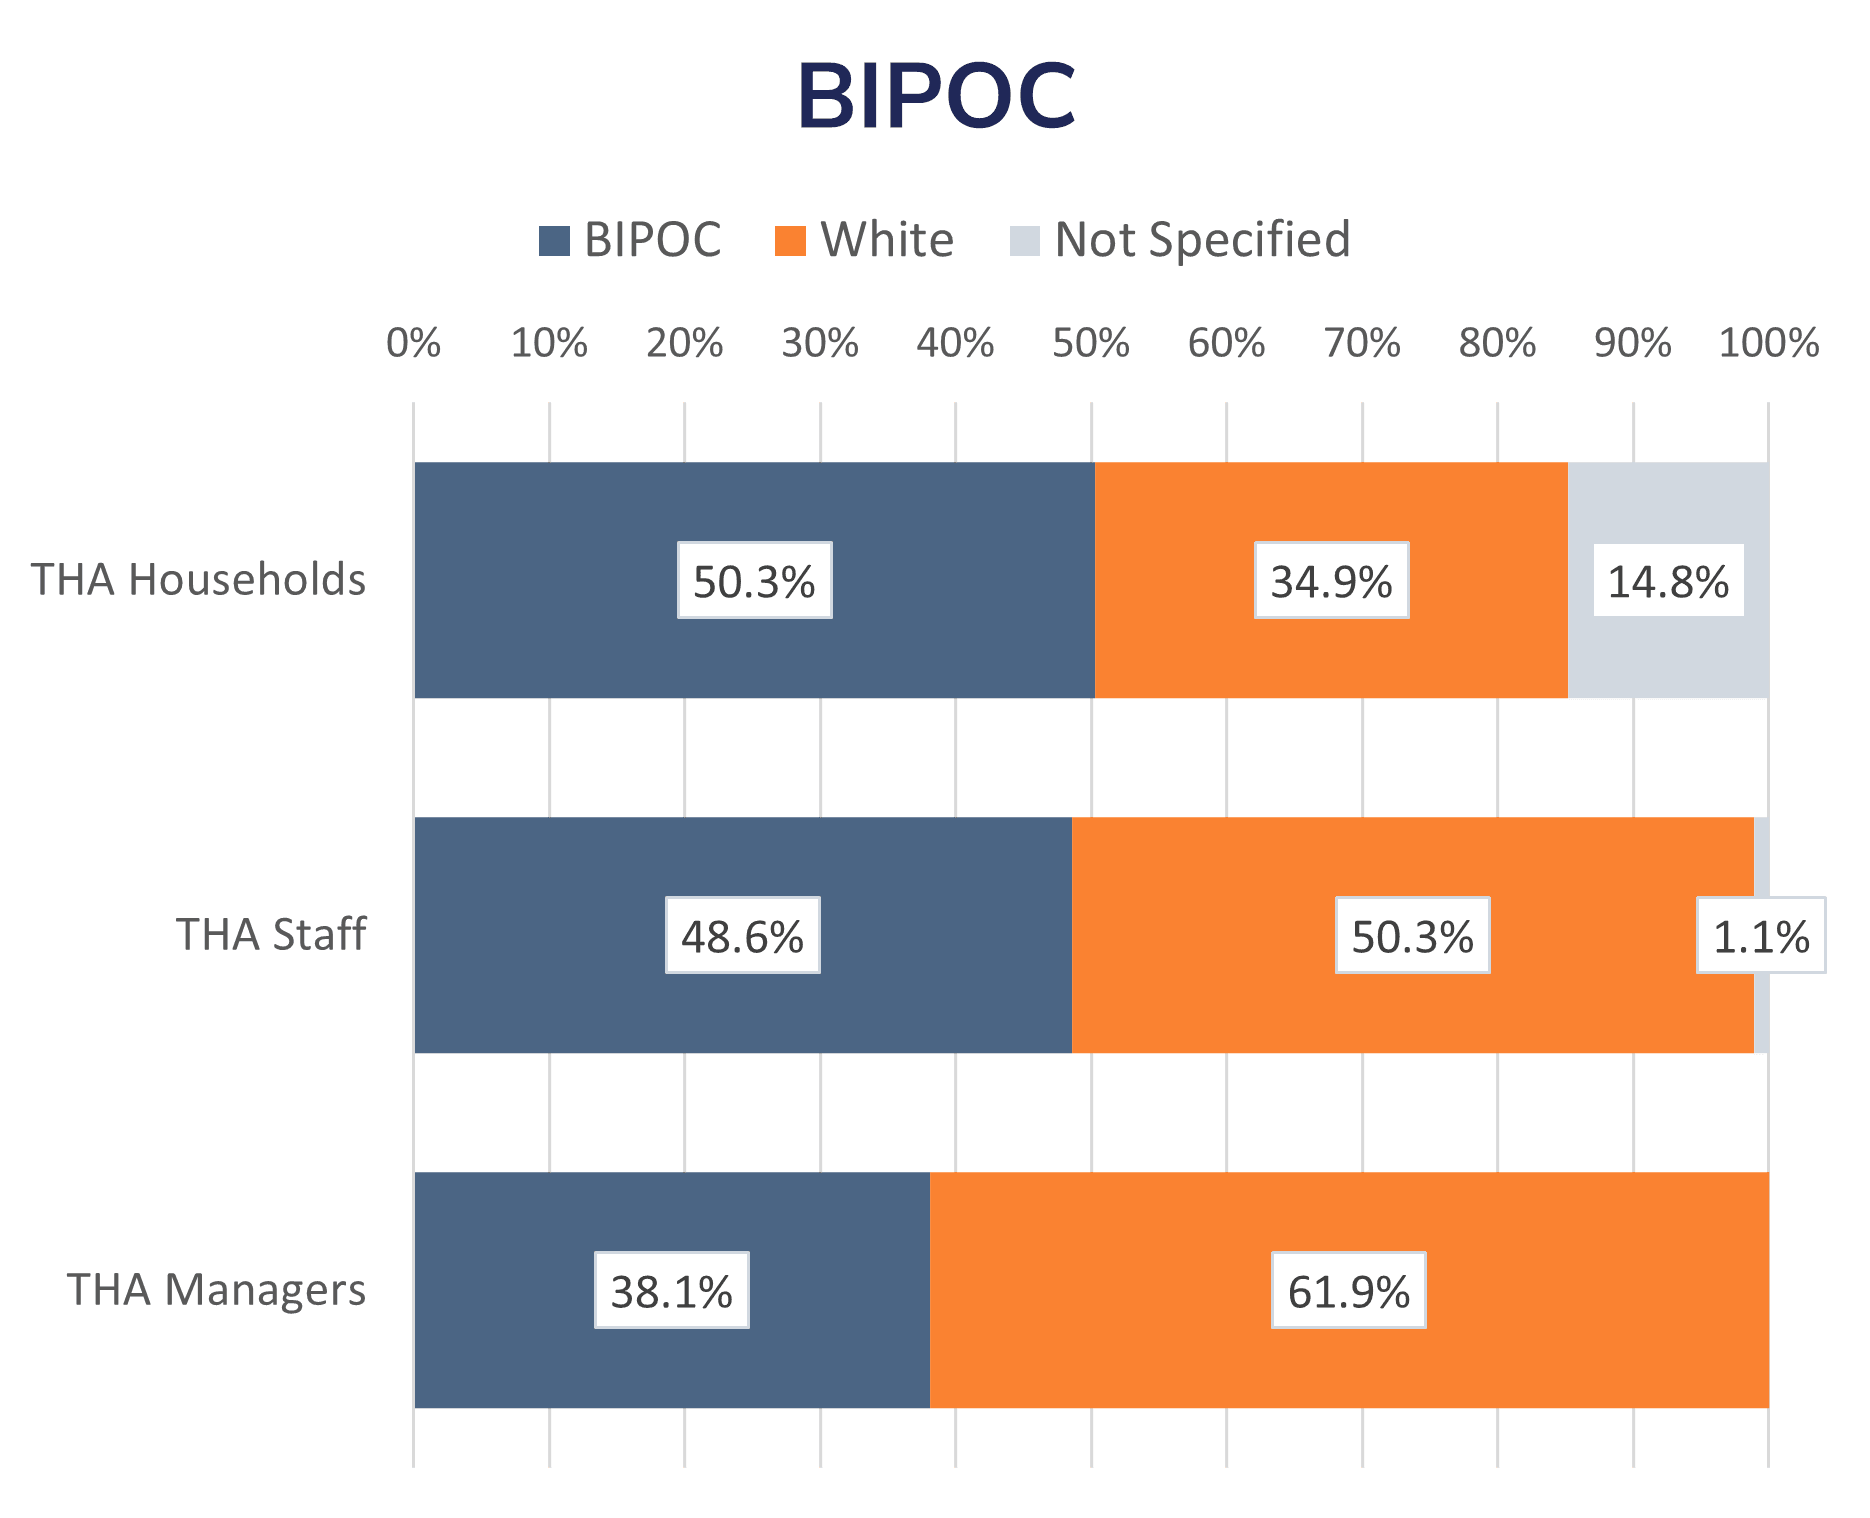
Population
BIPOC
White
Not Specified
THA Households
50.3%
34.9
14.8%
THA Staff
48.6%
50.3%
1.1%
THA Managers
54.8%
40.5%
—
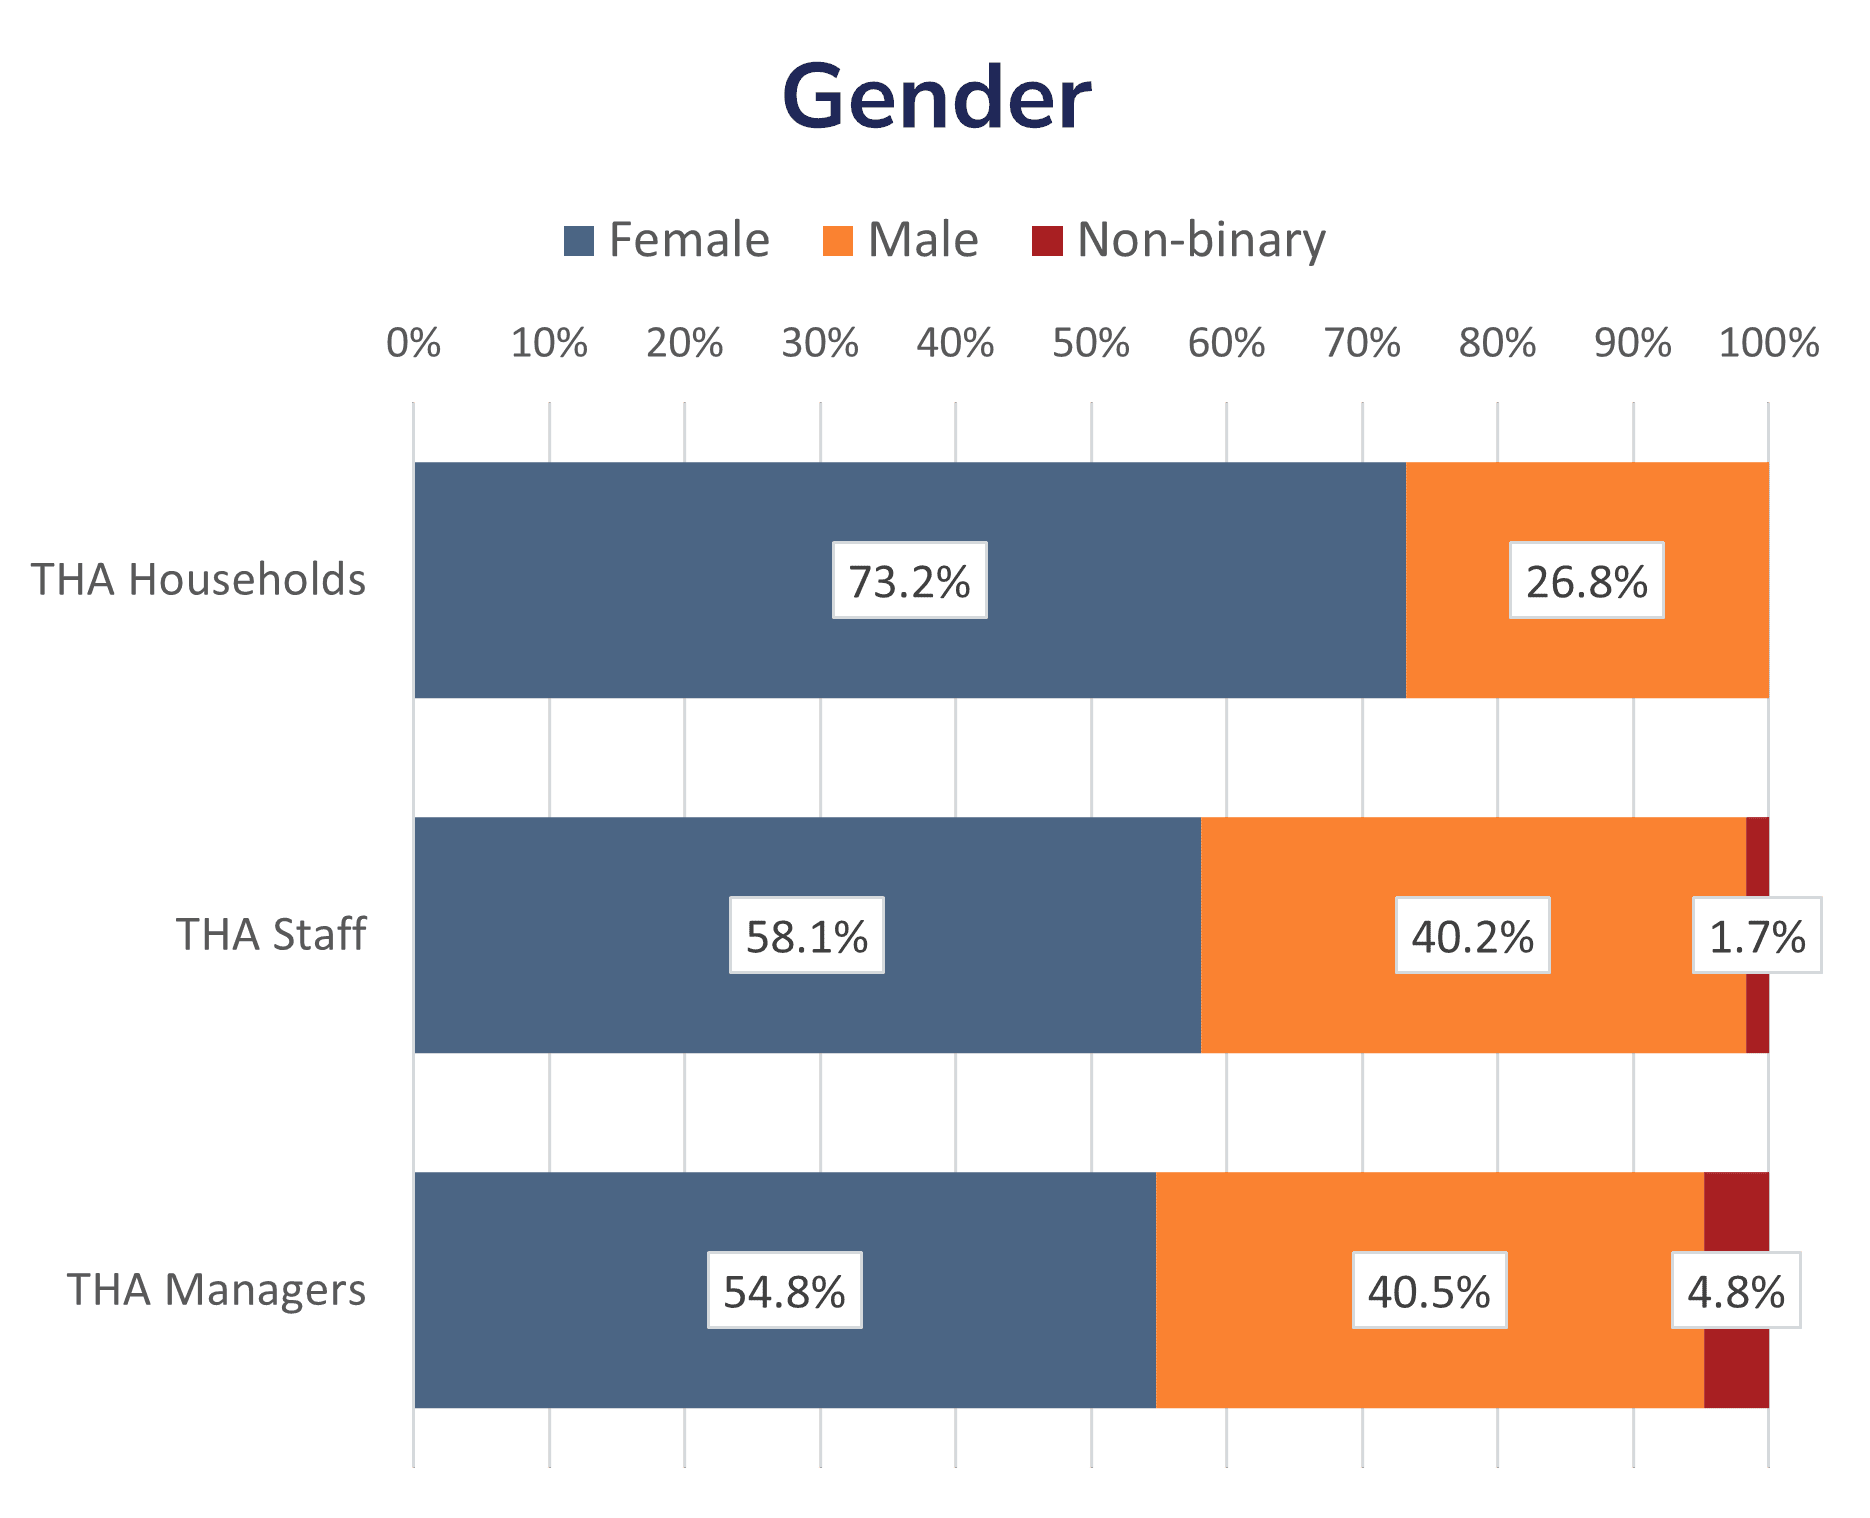
Population
Female
Male
Non-binary
THA Households
73.2%
26.8%
—
THA Staff
58.1%
40.2%
1.7%
THA Managers
54.8%
40.5%
4.8%
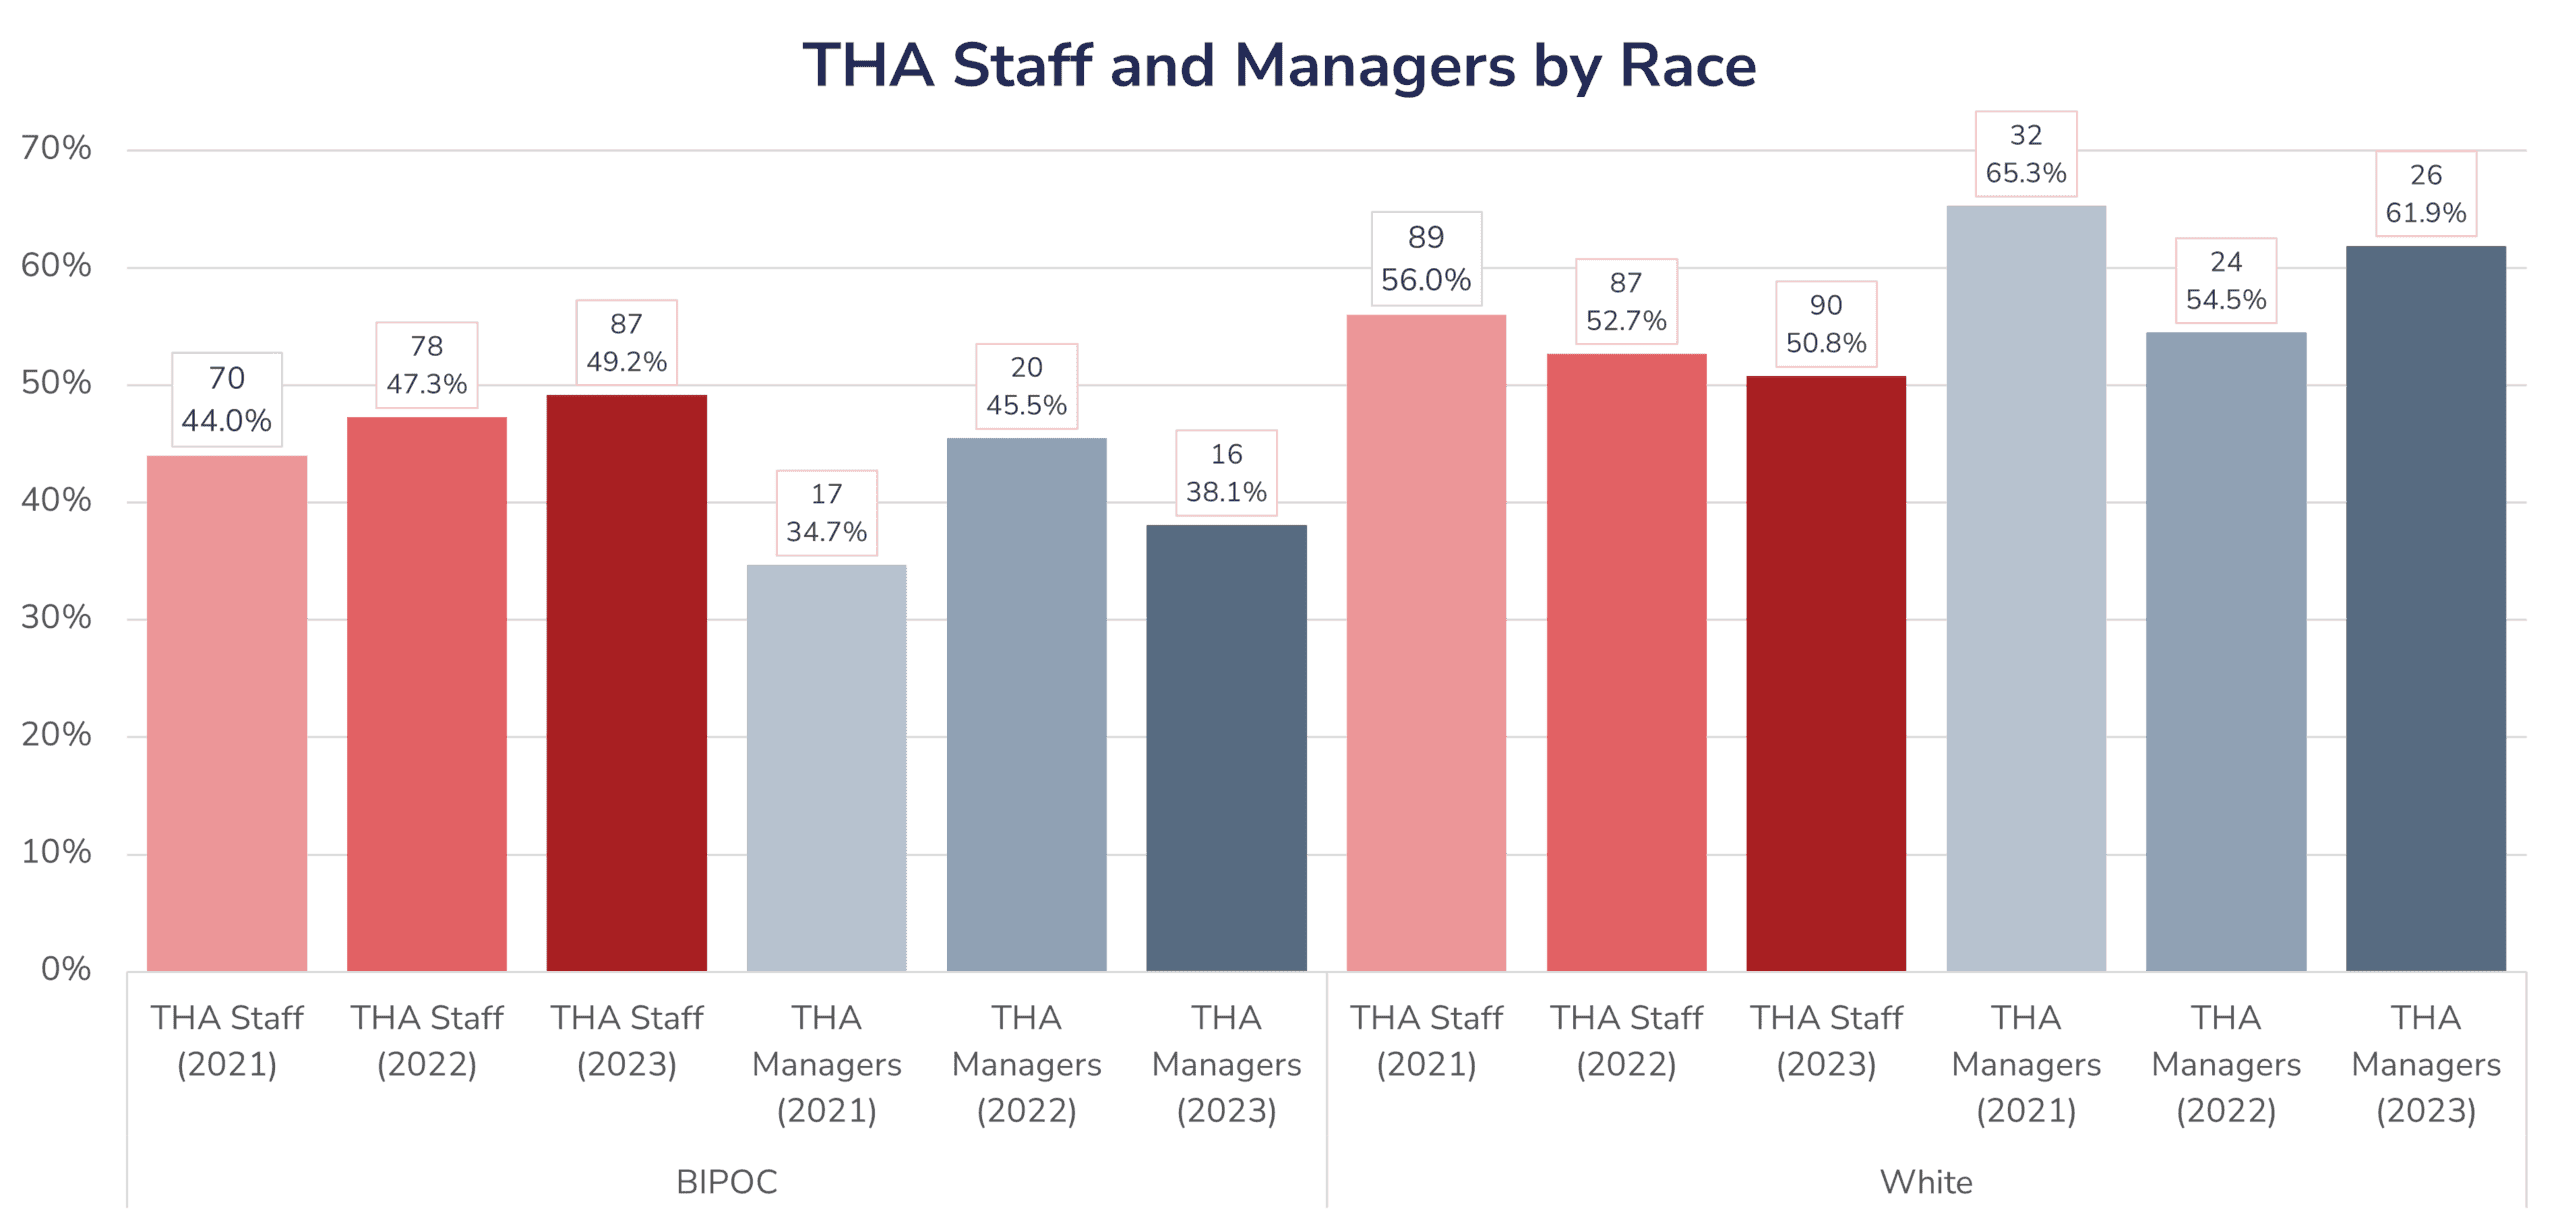
Population
BIPOC
White
THA Staff, 2021
70 (44.0%)
89 (56.0%)
THA Staff, 2022
78 (47.3%)
87 (52.7%)
THA Staff, 2023
87 (49.2%)
90 (50.8%)
THA Managers, 2021
17 (34.7%)
32 (65.3%)
THA Managers, 2022
20 (45.5%)
24 (54.5%)
THA Managers, 2023
16 (38.1%)
26 (61.9%)
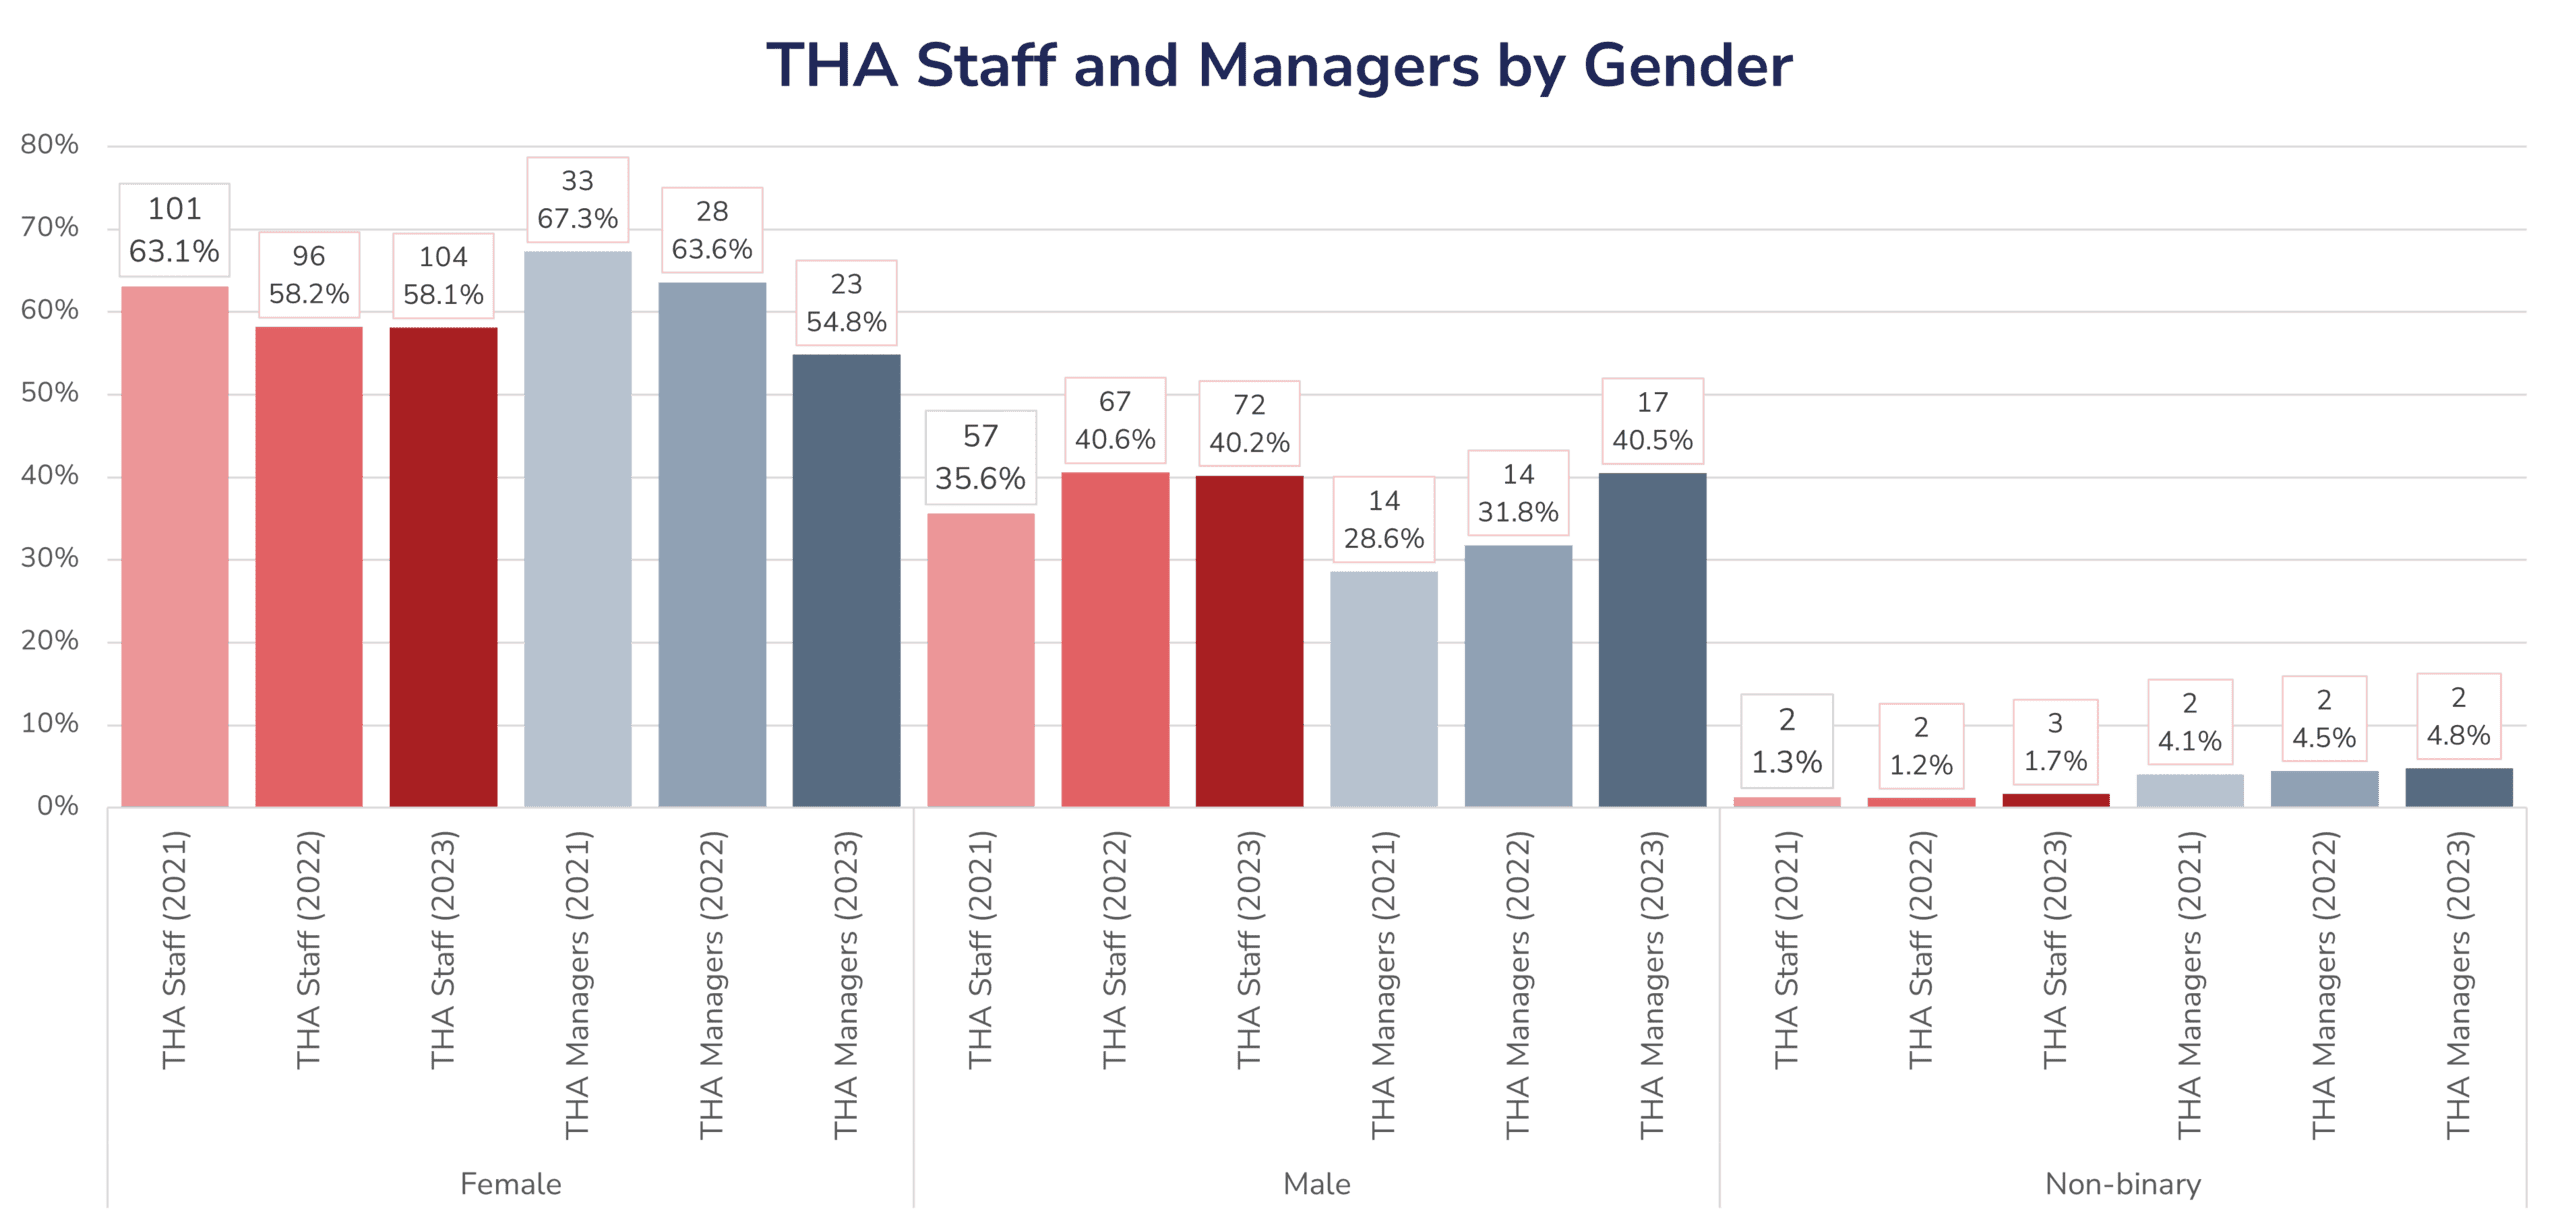
Population
Female
Male
Non-binary
THA Staff, 2021
101 (63.1%)
57 (35.6%)
2 (1.3%)
THA Staff, 2022
96 (58.2%)
67 (40.6%)
2 (1.2%)
THA Staff, 2023
104 (58.1%)
72 (40.2%)
3 (1.7%)
THA Managers, 2021
33 (67.3%)
14 (28.6%)
2 (4.1%)
THA Managers, 2022
28 (63.6%)
14 (31.8%)
2 (4.5%)
THA Managers, 2023
23 (54.8%)
17 (40.5%)
2 (4.8%)
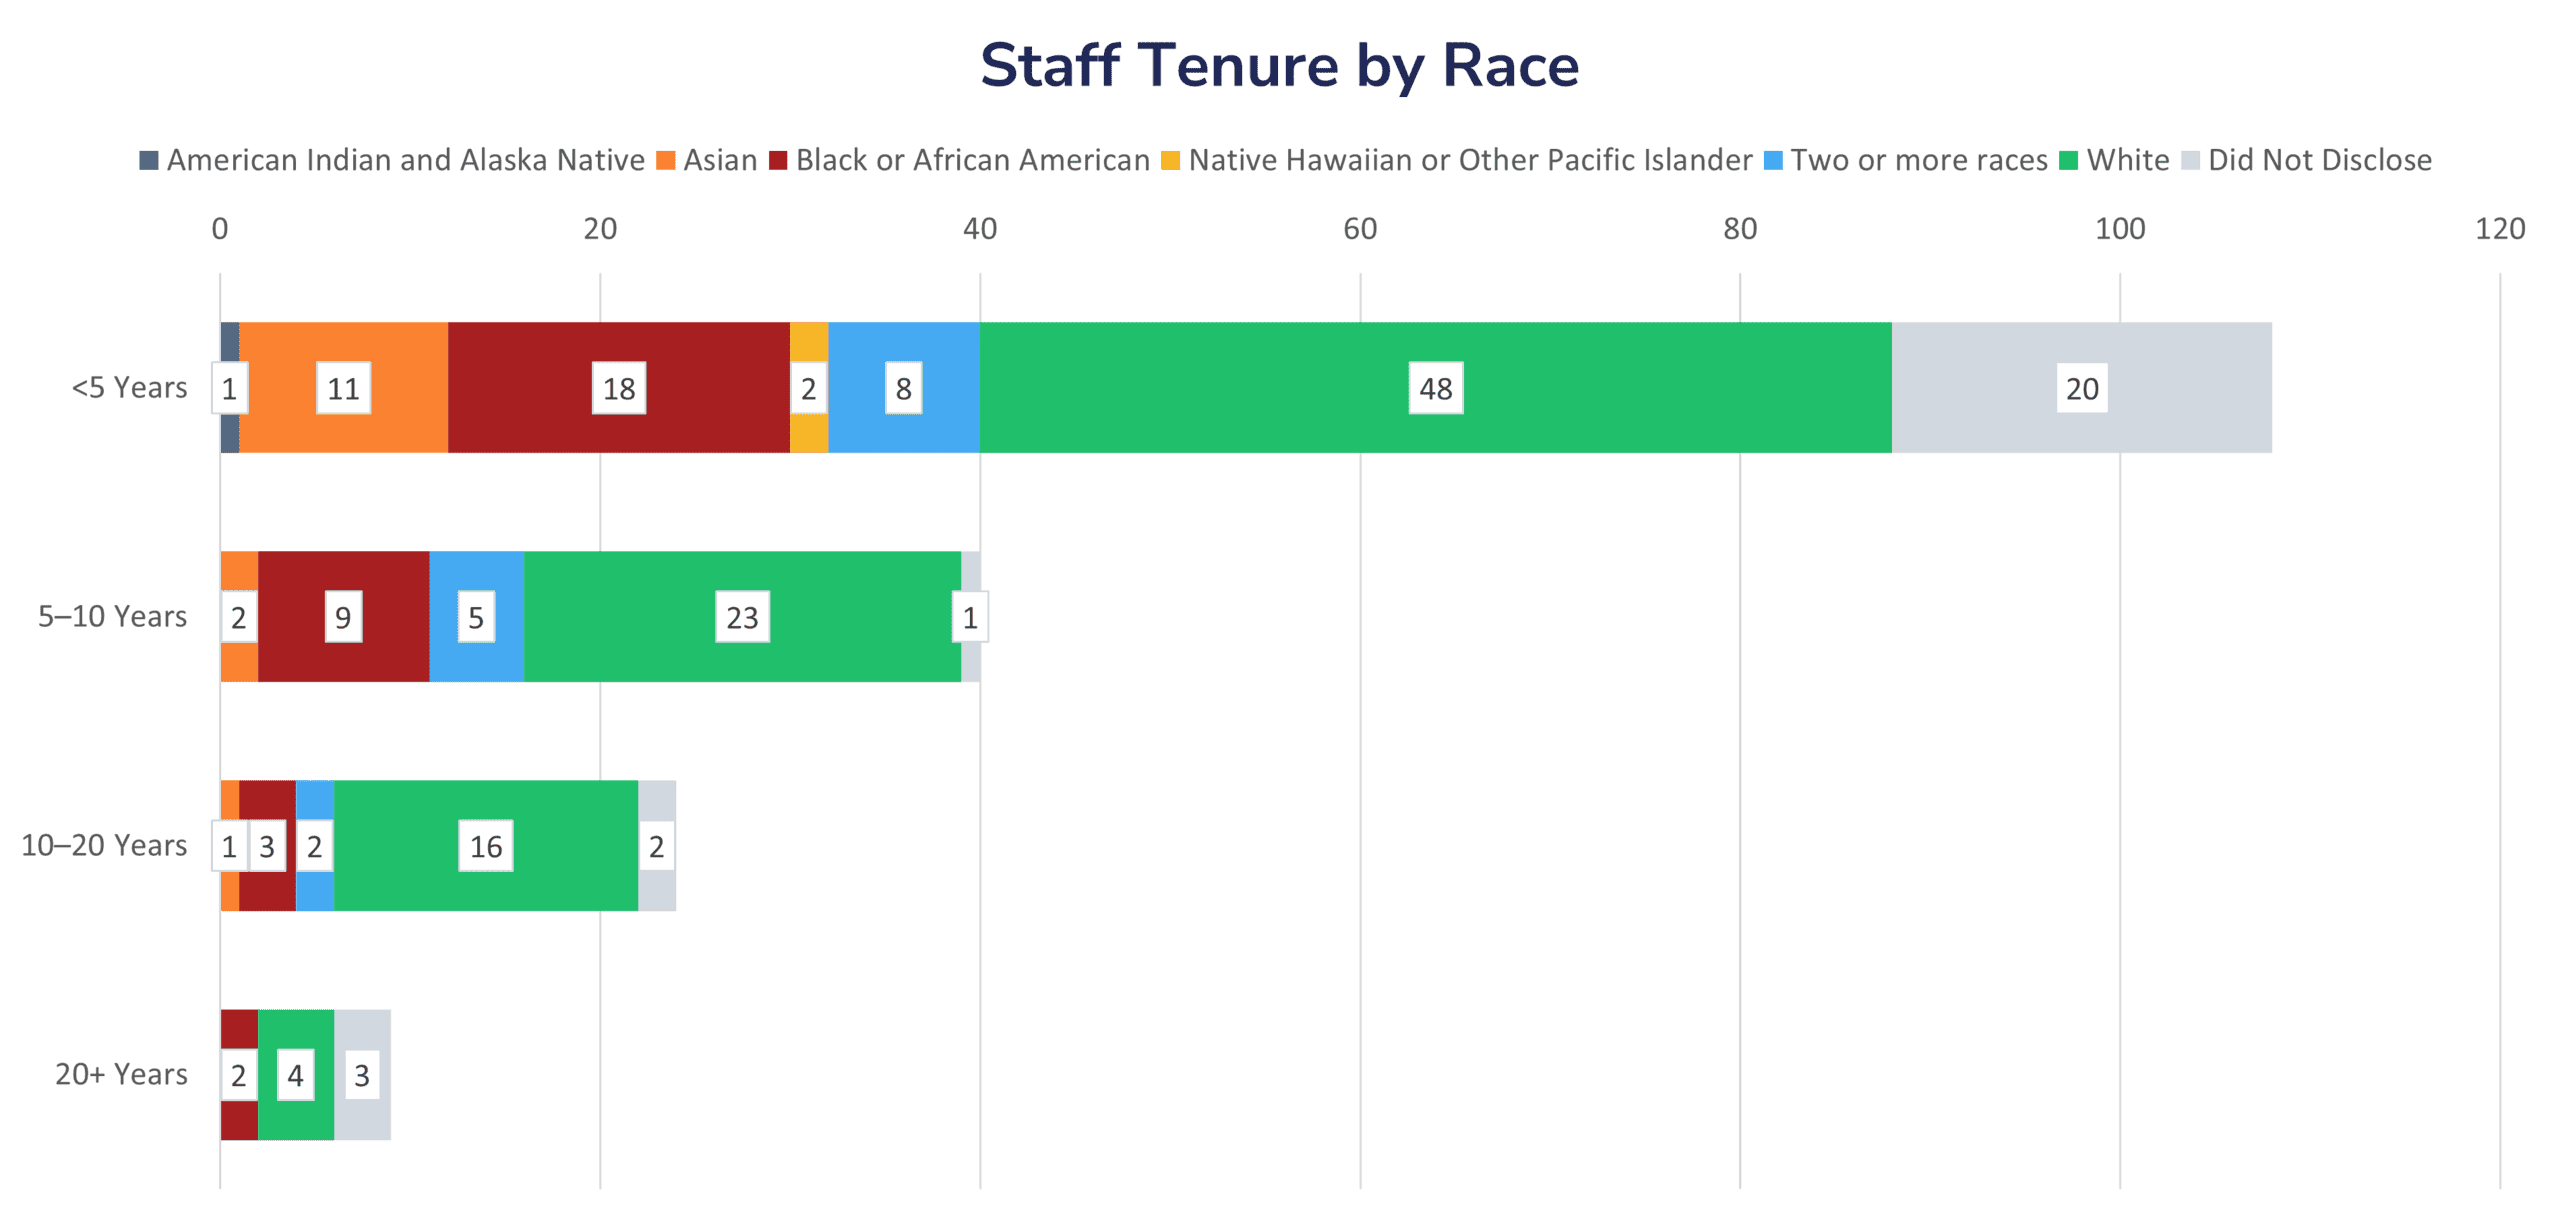
Staff Tenure
THA offers staff an opportunity to grow, with dozens who have spent more than 10 years at the agency. Several long-time THA staffers have been promoted to managerial positions as well.
We have also seen an increase in the number and percentage of new BIPOC staff. This increase helps increase the overall diversity of THA.
Race
Less Than 5 Years
5–10 Years
10–20 Years
20 Years or More
American Indian and Alaska Native
1
—
—
—
Asian
11
2
1
—
Black or African American
18
9
3
2
Native Hawaiian or Other Pacific Islander
2
—
—
—
Two or more races
8
5
2
—
White
48
23
16
4
Did Not Disclose
20
1
2
3
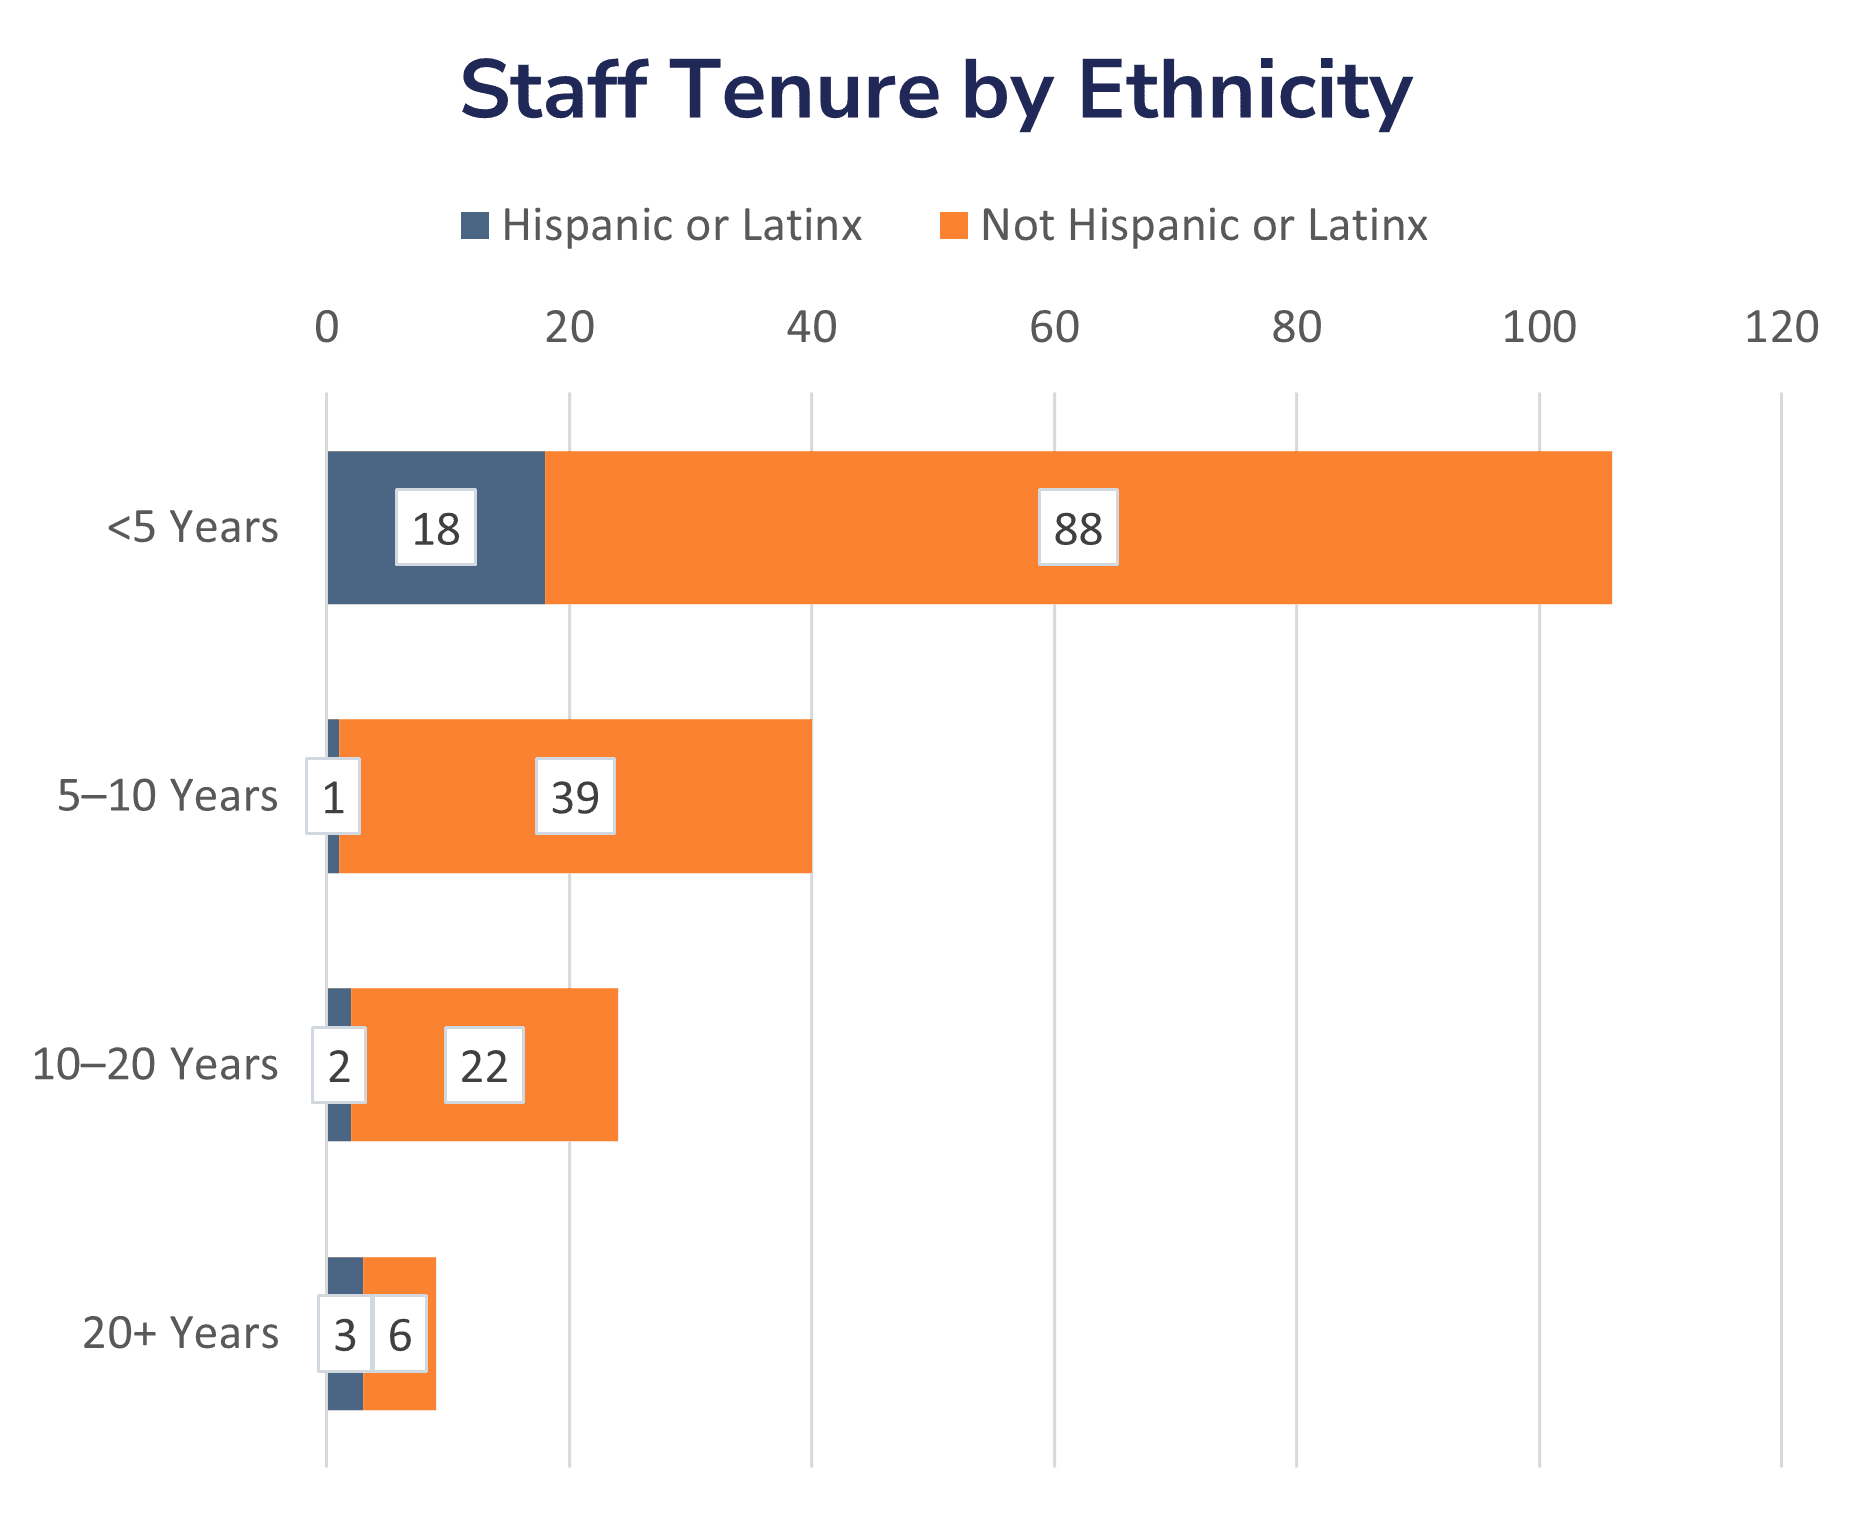
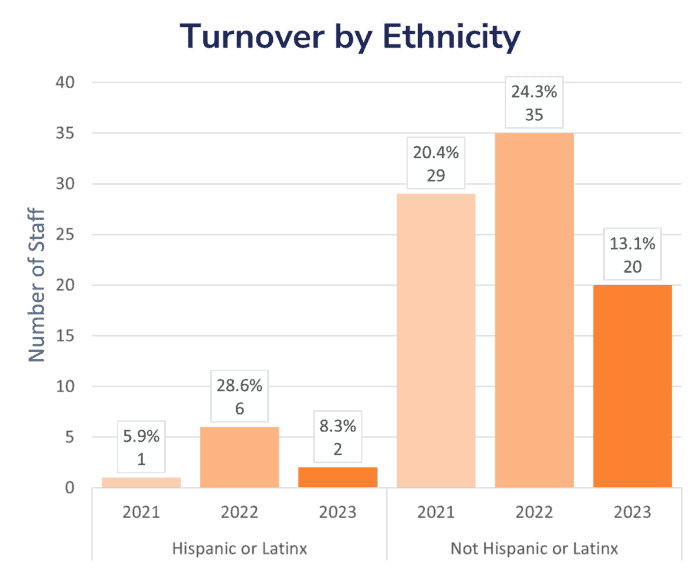
Ethnicity
Less Than 5 Years
5–10 Years
10–20 Years
20 Years or More
Hispanic or Latinx
18
1
2
3
Not Hispanic or Latinx
88
39
22
6
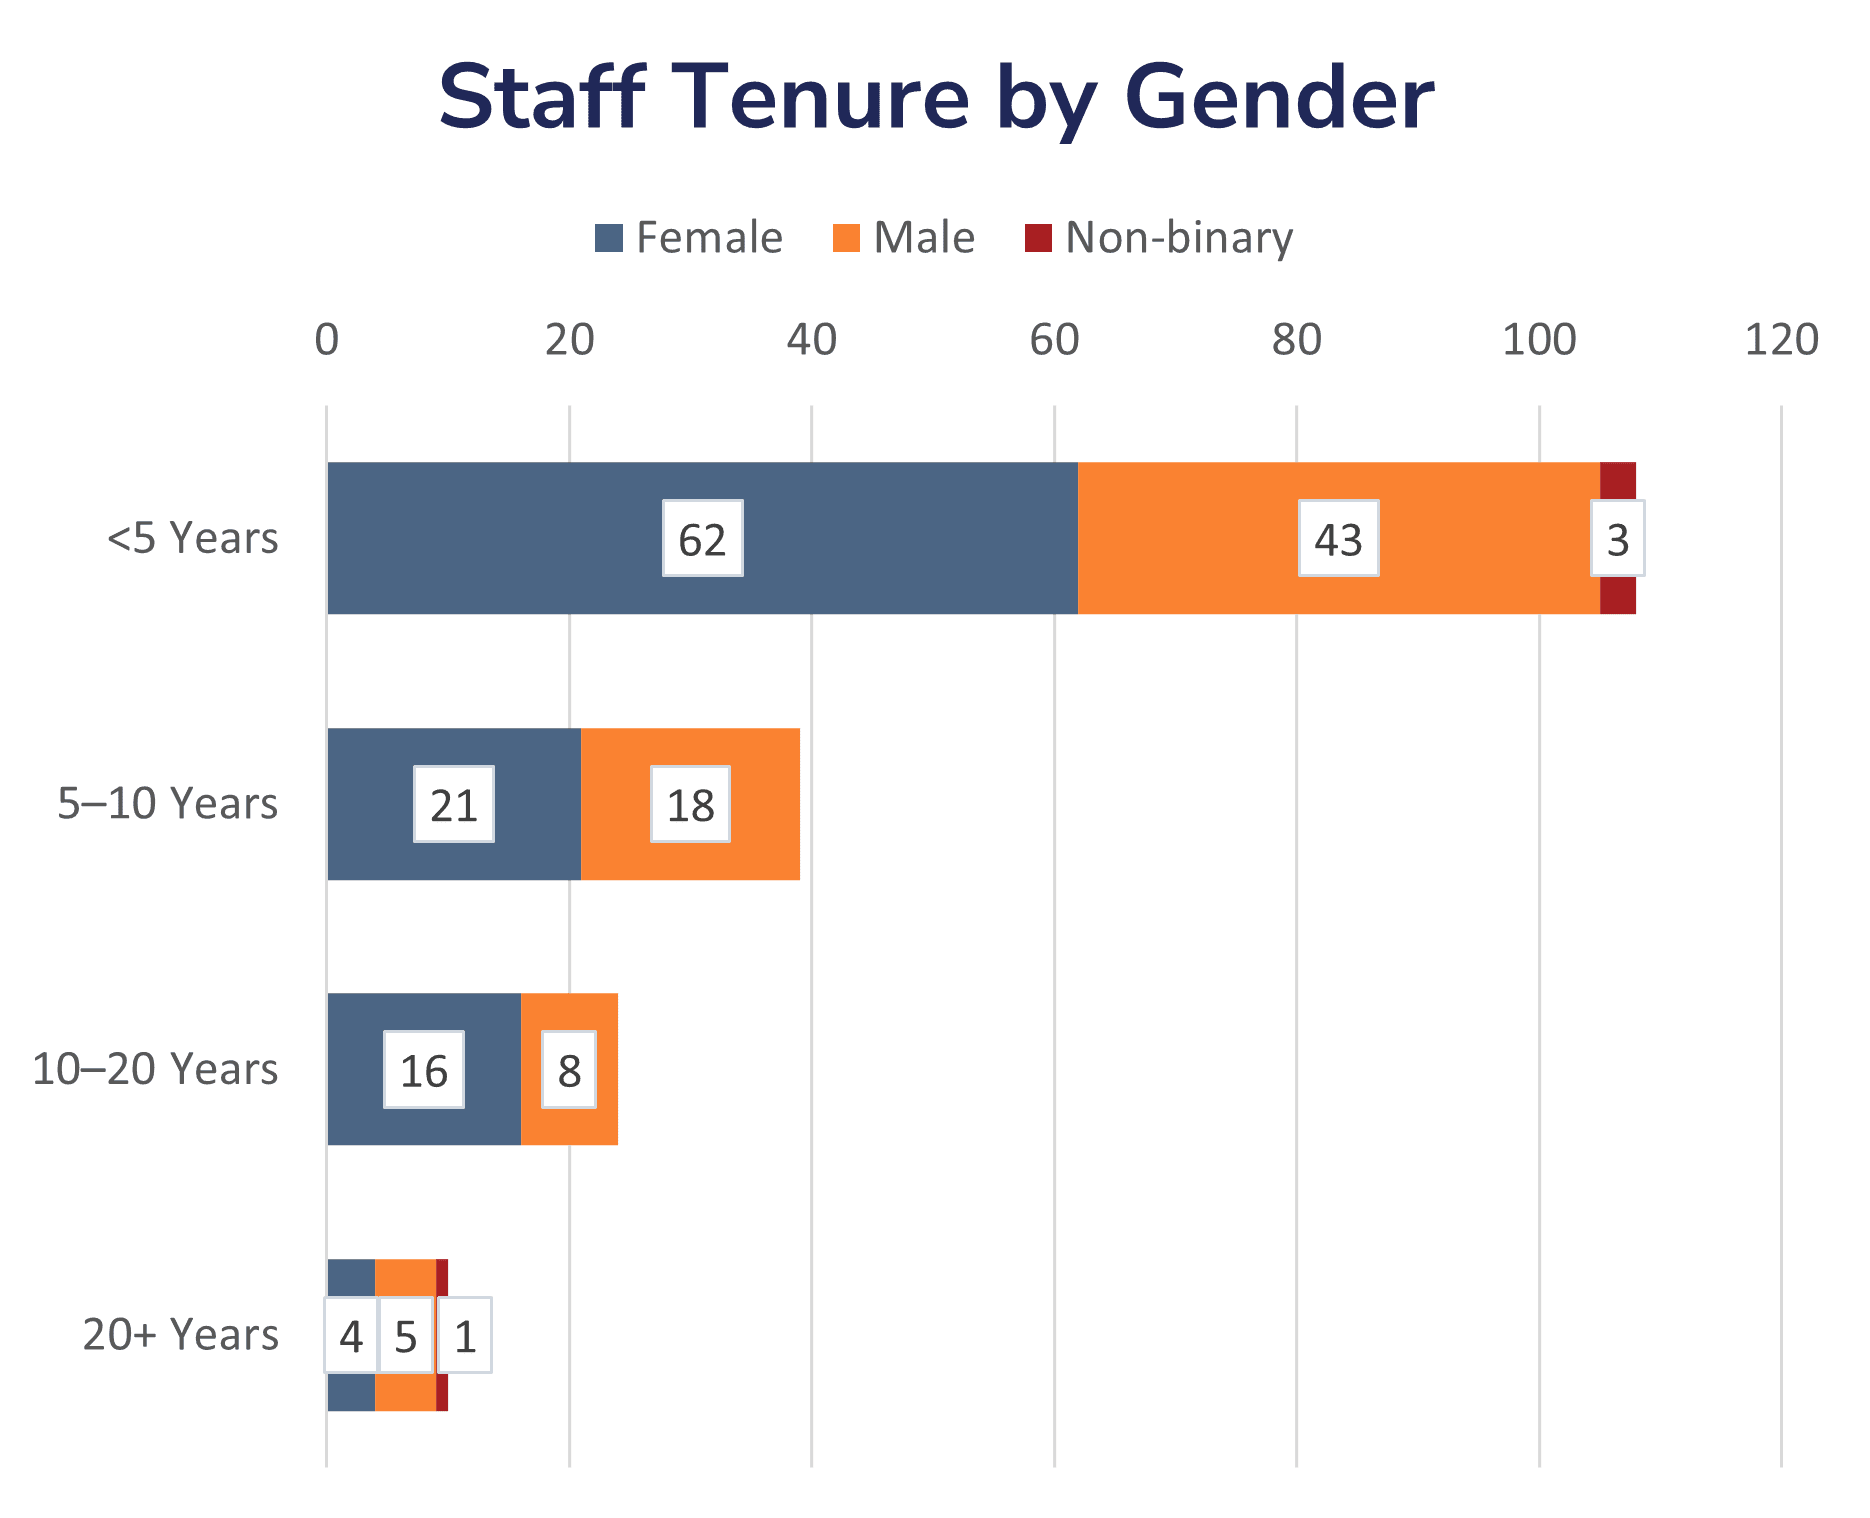
Gender
Less Than 5 Years
5–10 Years
10–20 Years
20 Years or More
Female
62
21
16
4
Male
43
18
8
5
Non-binary
3
—
—
1
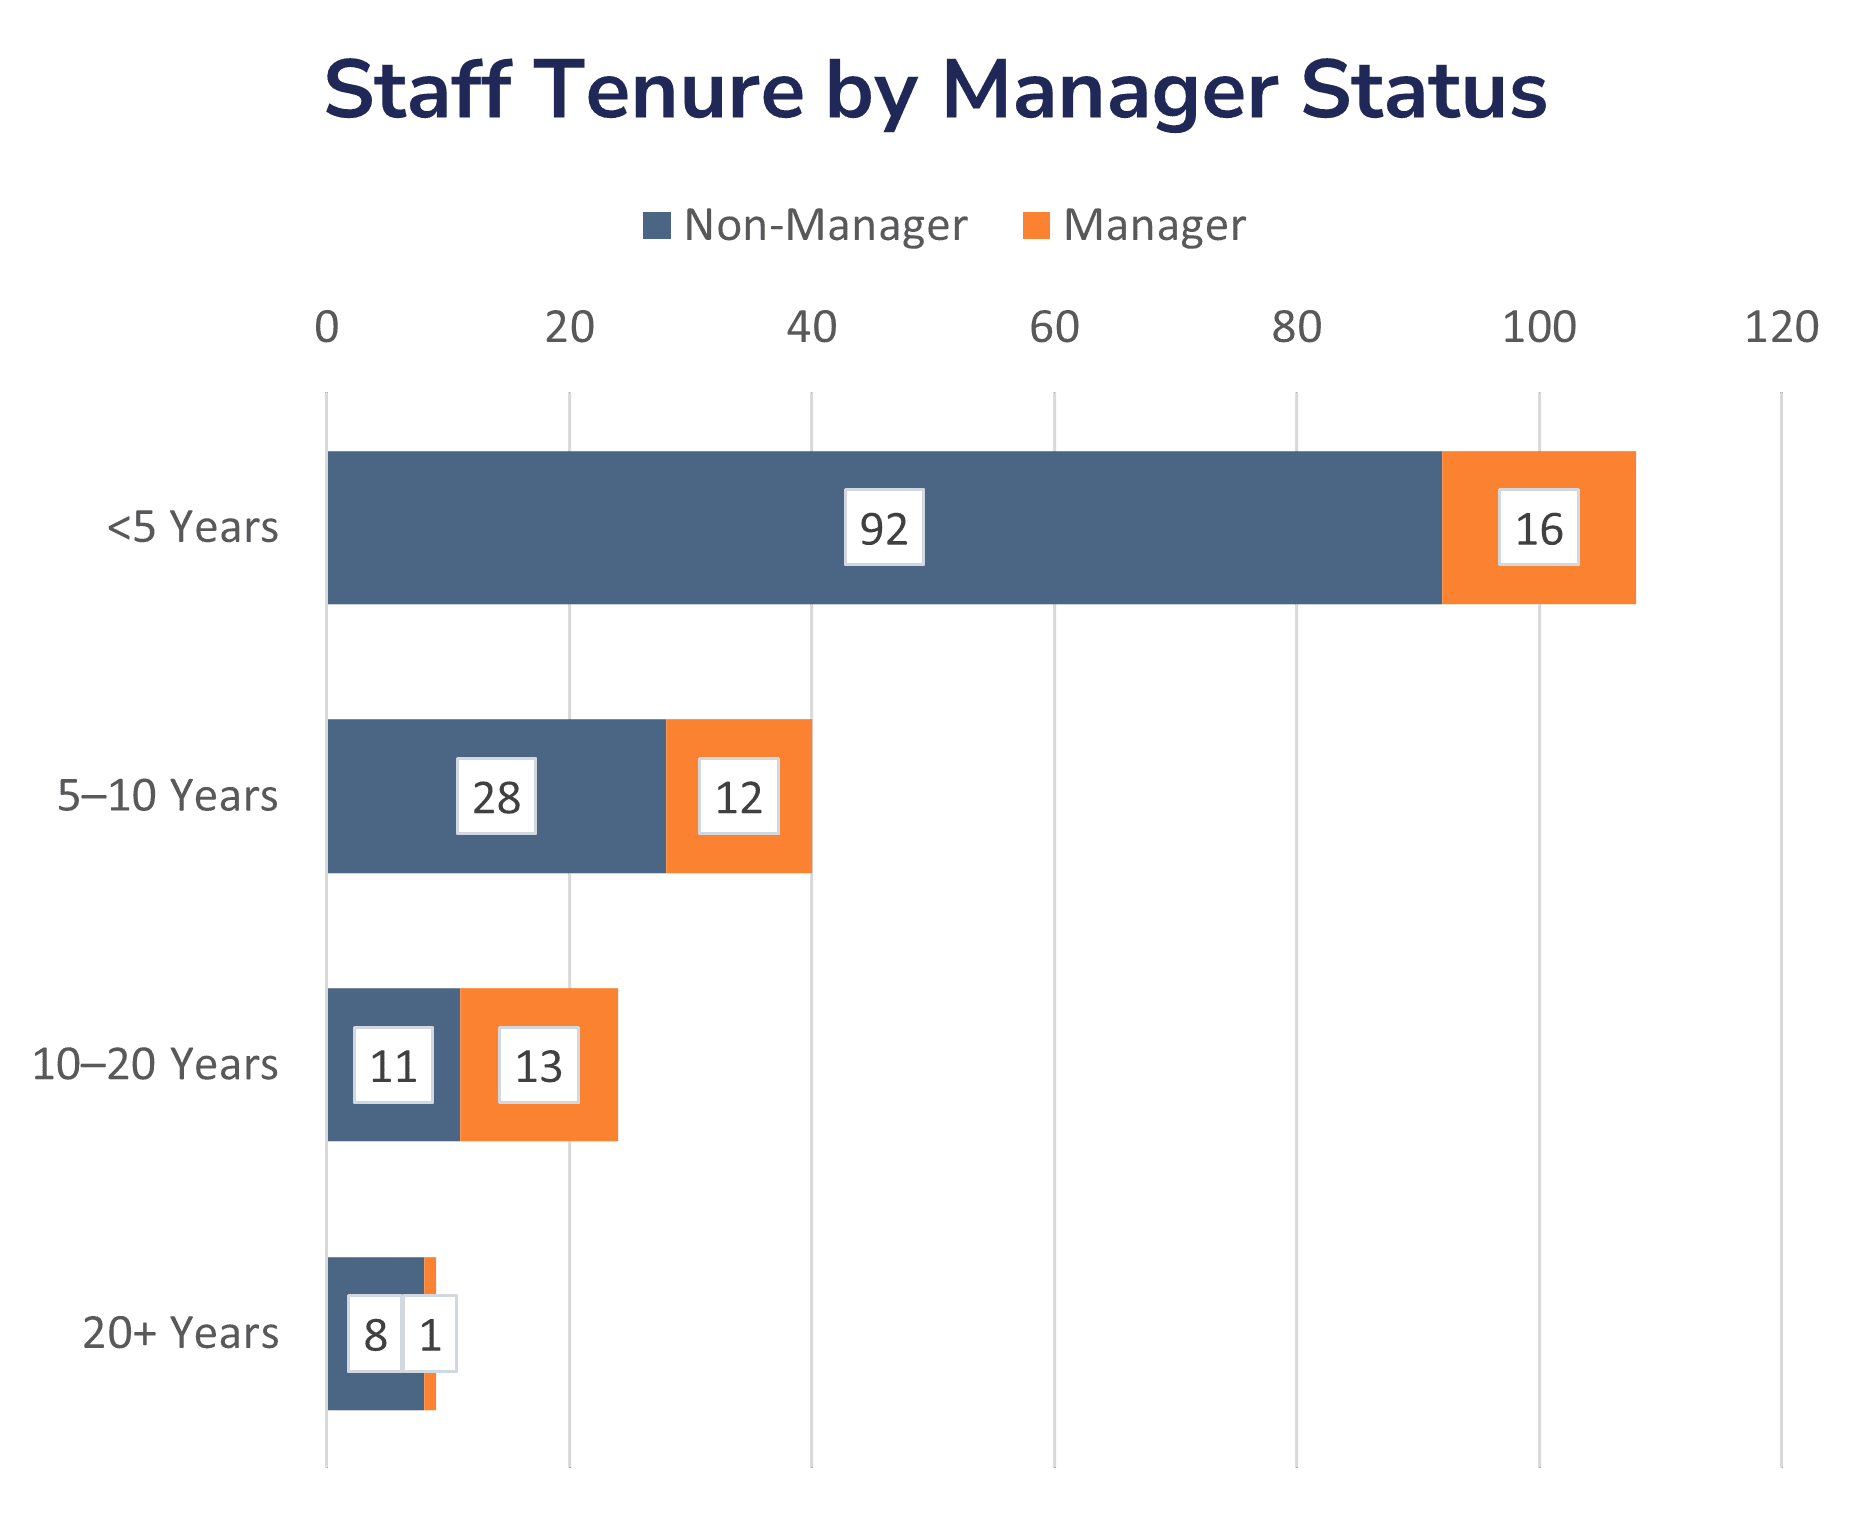
Manager Status
Less Than 5 Years
5–10 Years
10–20 Years
20 Years or More
Non-Manager
92
28
11
8
Manager
16
12
13
1
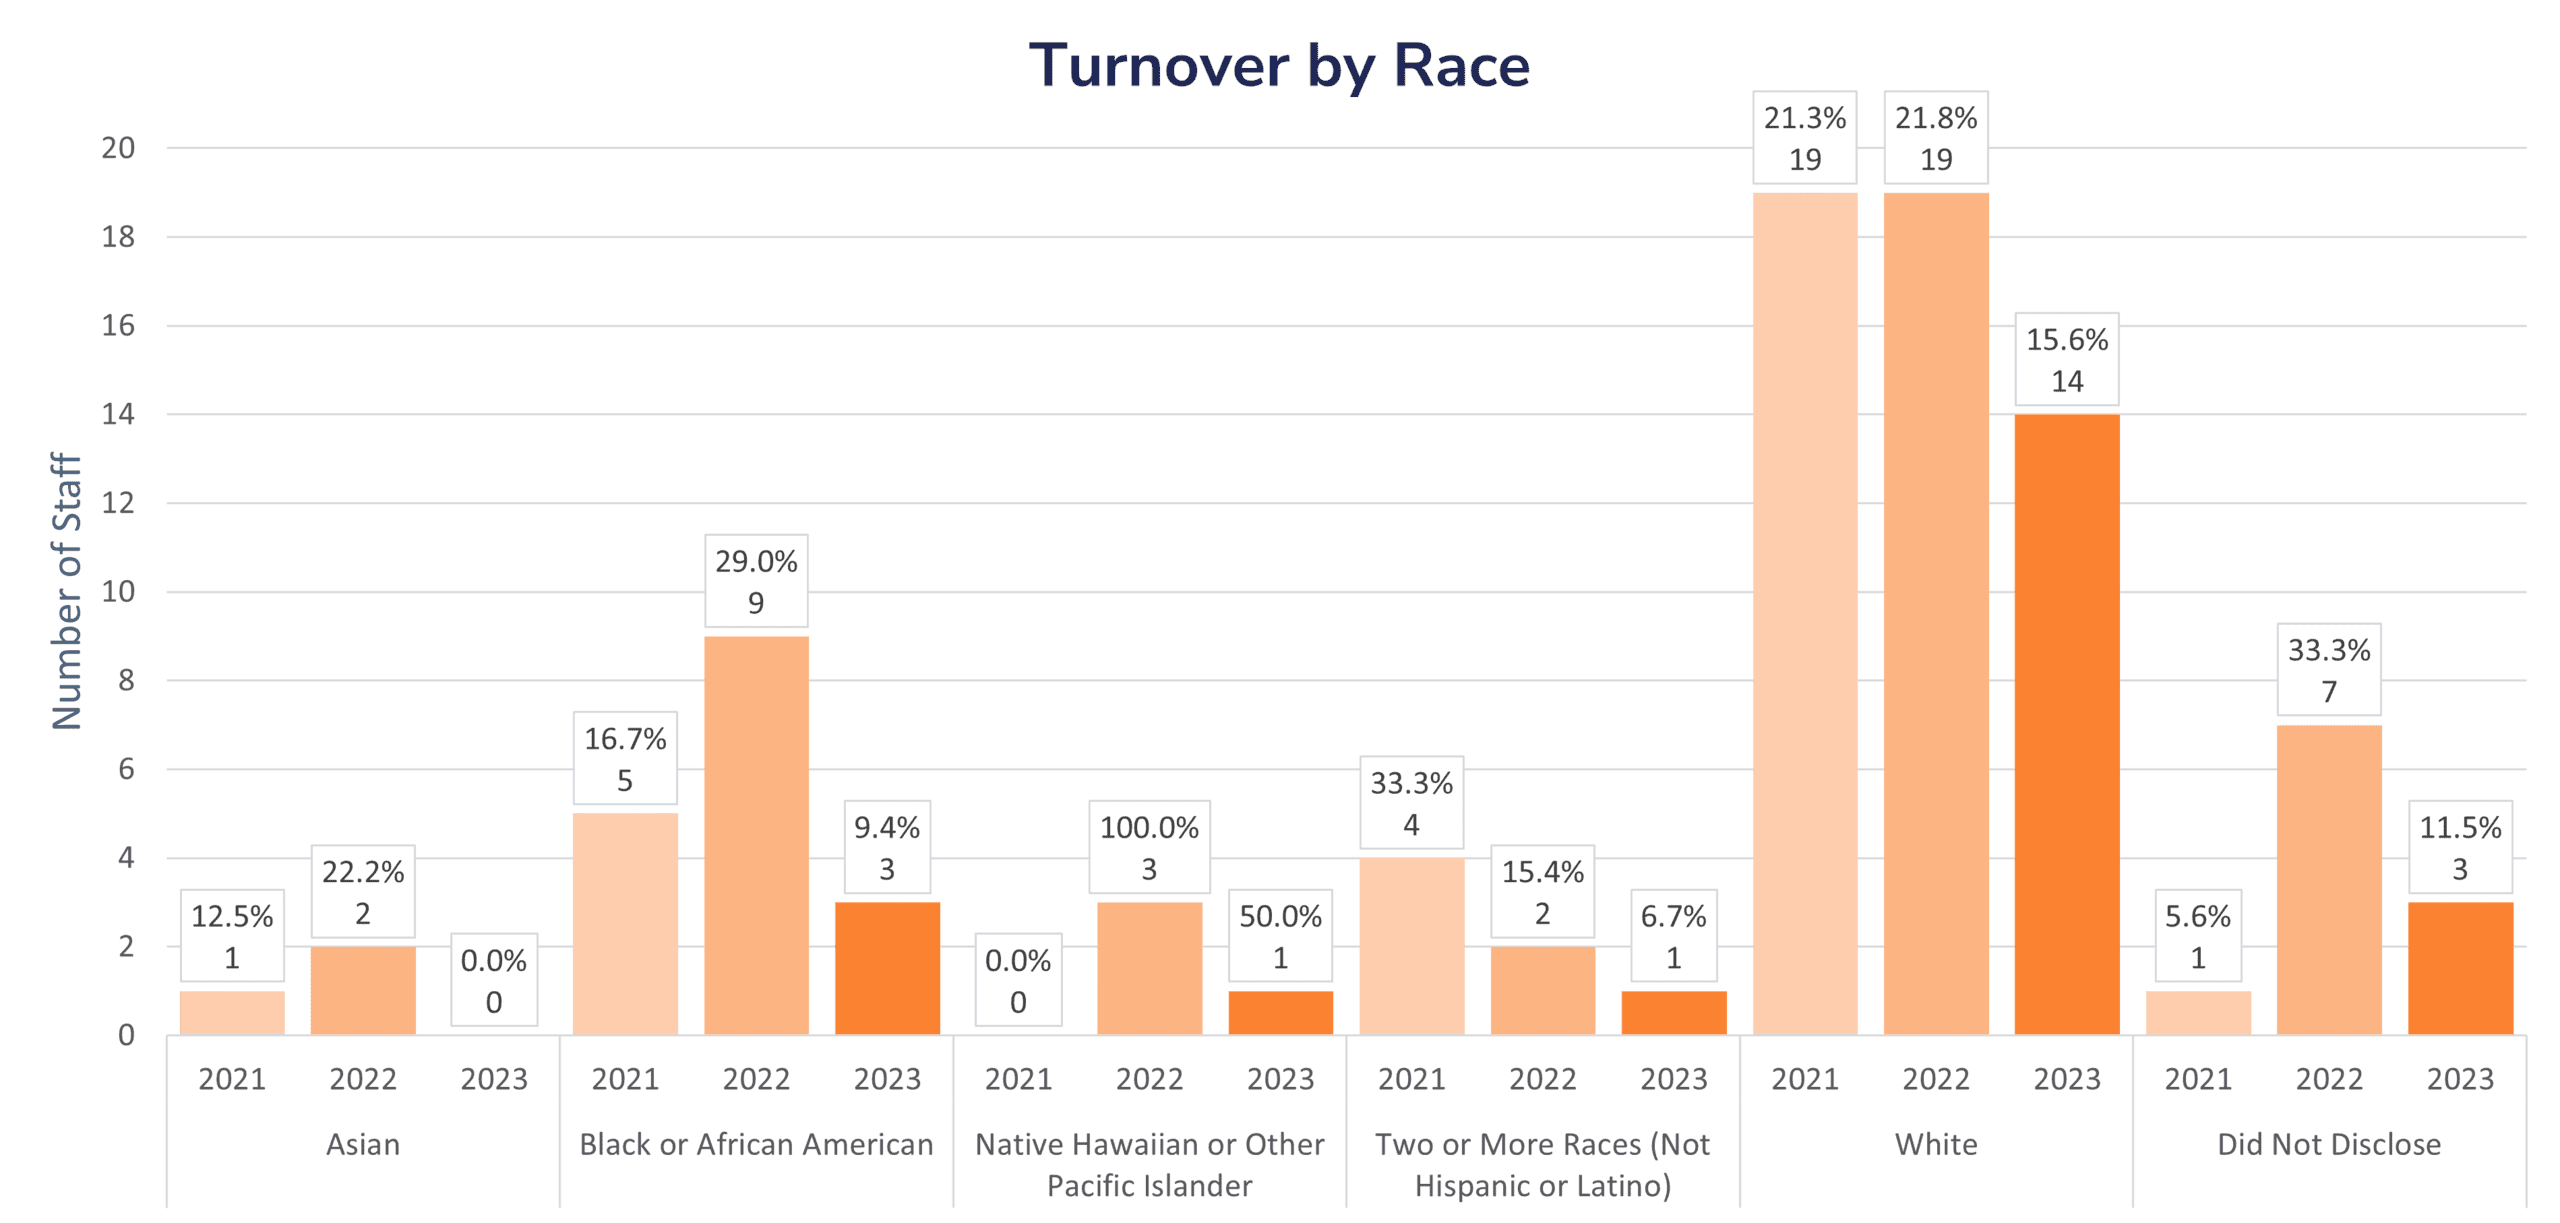
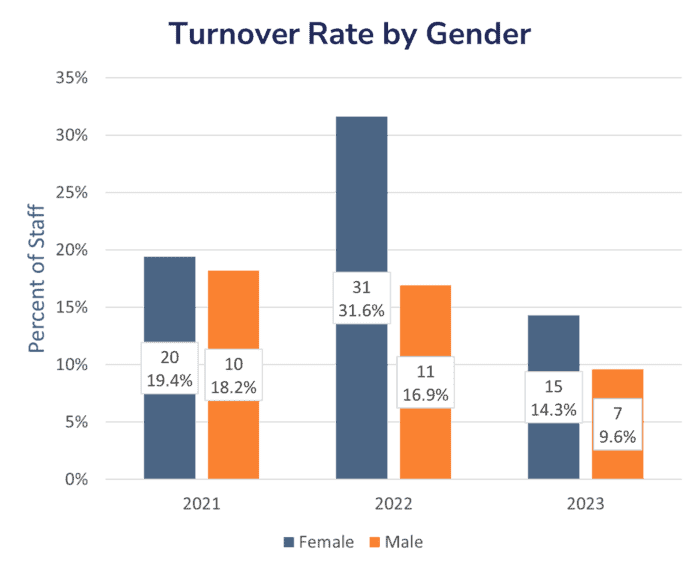
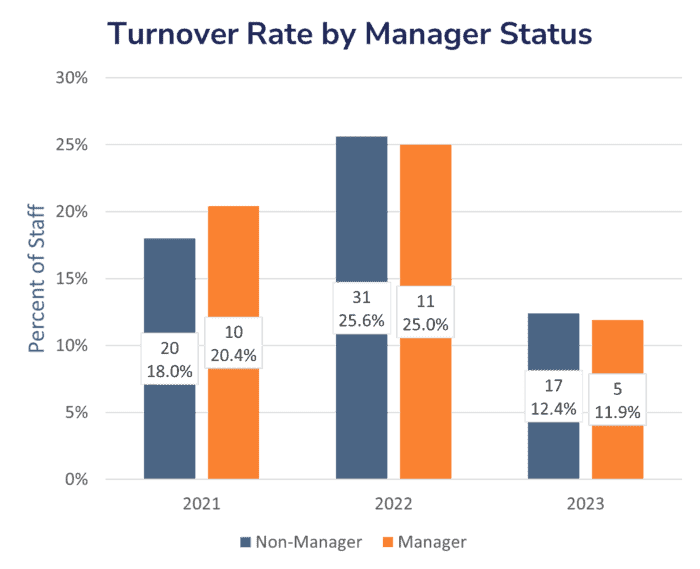
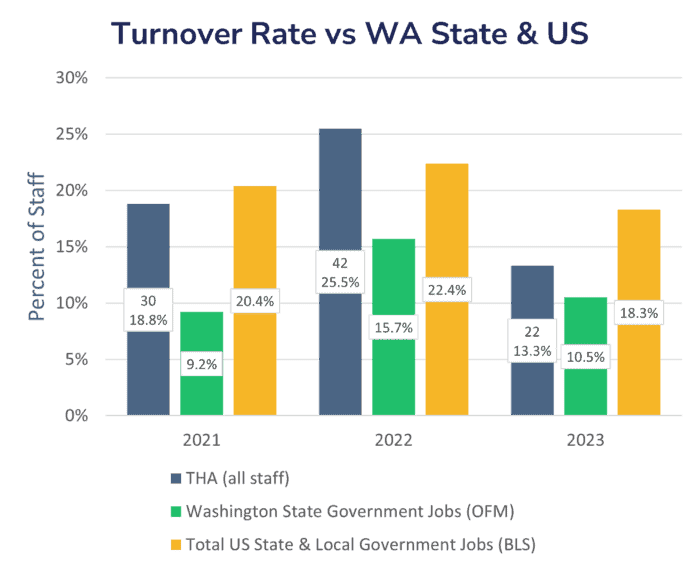
Staff Turnover
THA set a goal to reduce turnover below 25% and, ideally, equal to or better than state and local trends, and to see no disparity in turnover amongst historically marginalized staff.
Year
Asian
Black or African American
Native Hawaiian or Other Pacific Islander
Two or More Races (Not Hispanic or Latino)
White
Did Not Disclose
2021
1 (12.5%)
5 (16.7%)
0
4 (33.3%)
19 (21.3%)
1 (5.6%)
2022
2 (22.2%)
9 (29.0%)
3 (100%)
2 (15.4%)
19 (21.8%)
7 (33.3%)
2023
0
3 (9.4%)
1 (50%)
1 (6.7%)
14 (15.6%)
3 (11.5%)
“American Indian or Alaska Native” and “Did Not Disclose” not shown (no turnover during this period)