A snapshot of THA household data
June 2023
Households Served by THA in June 2023
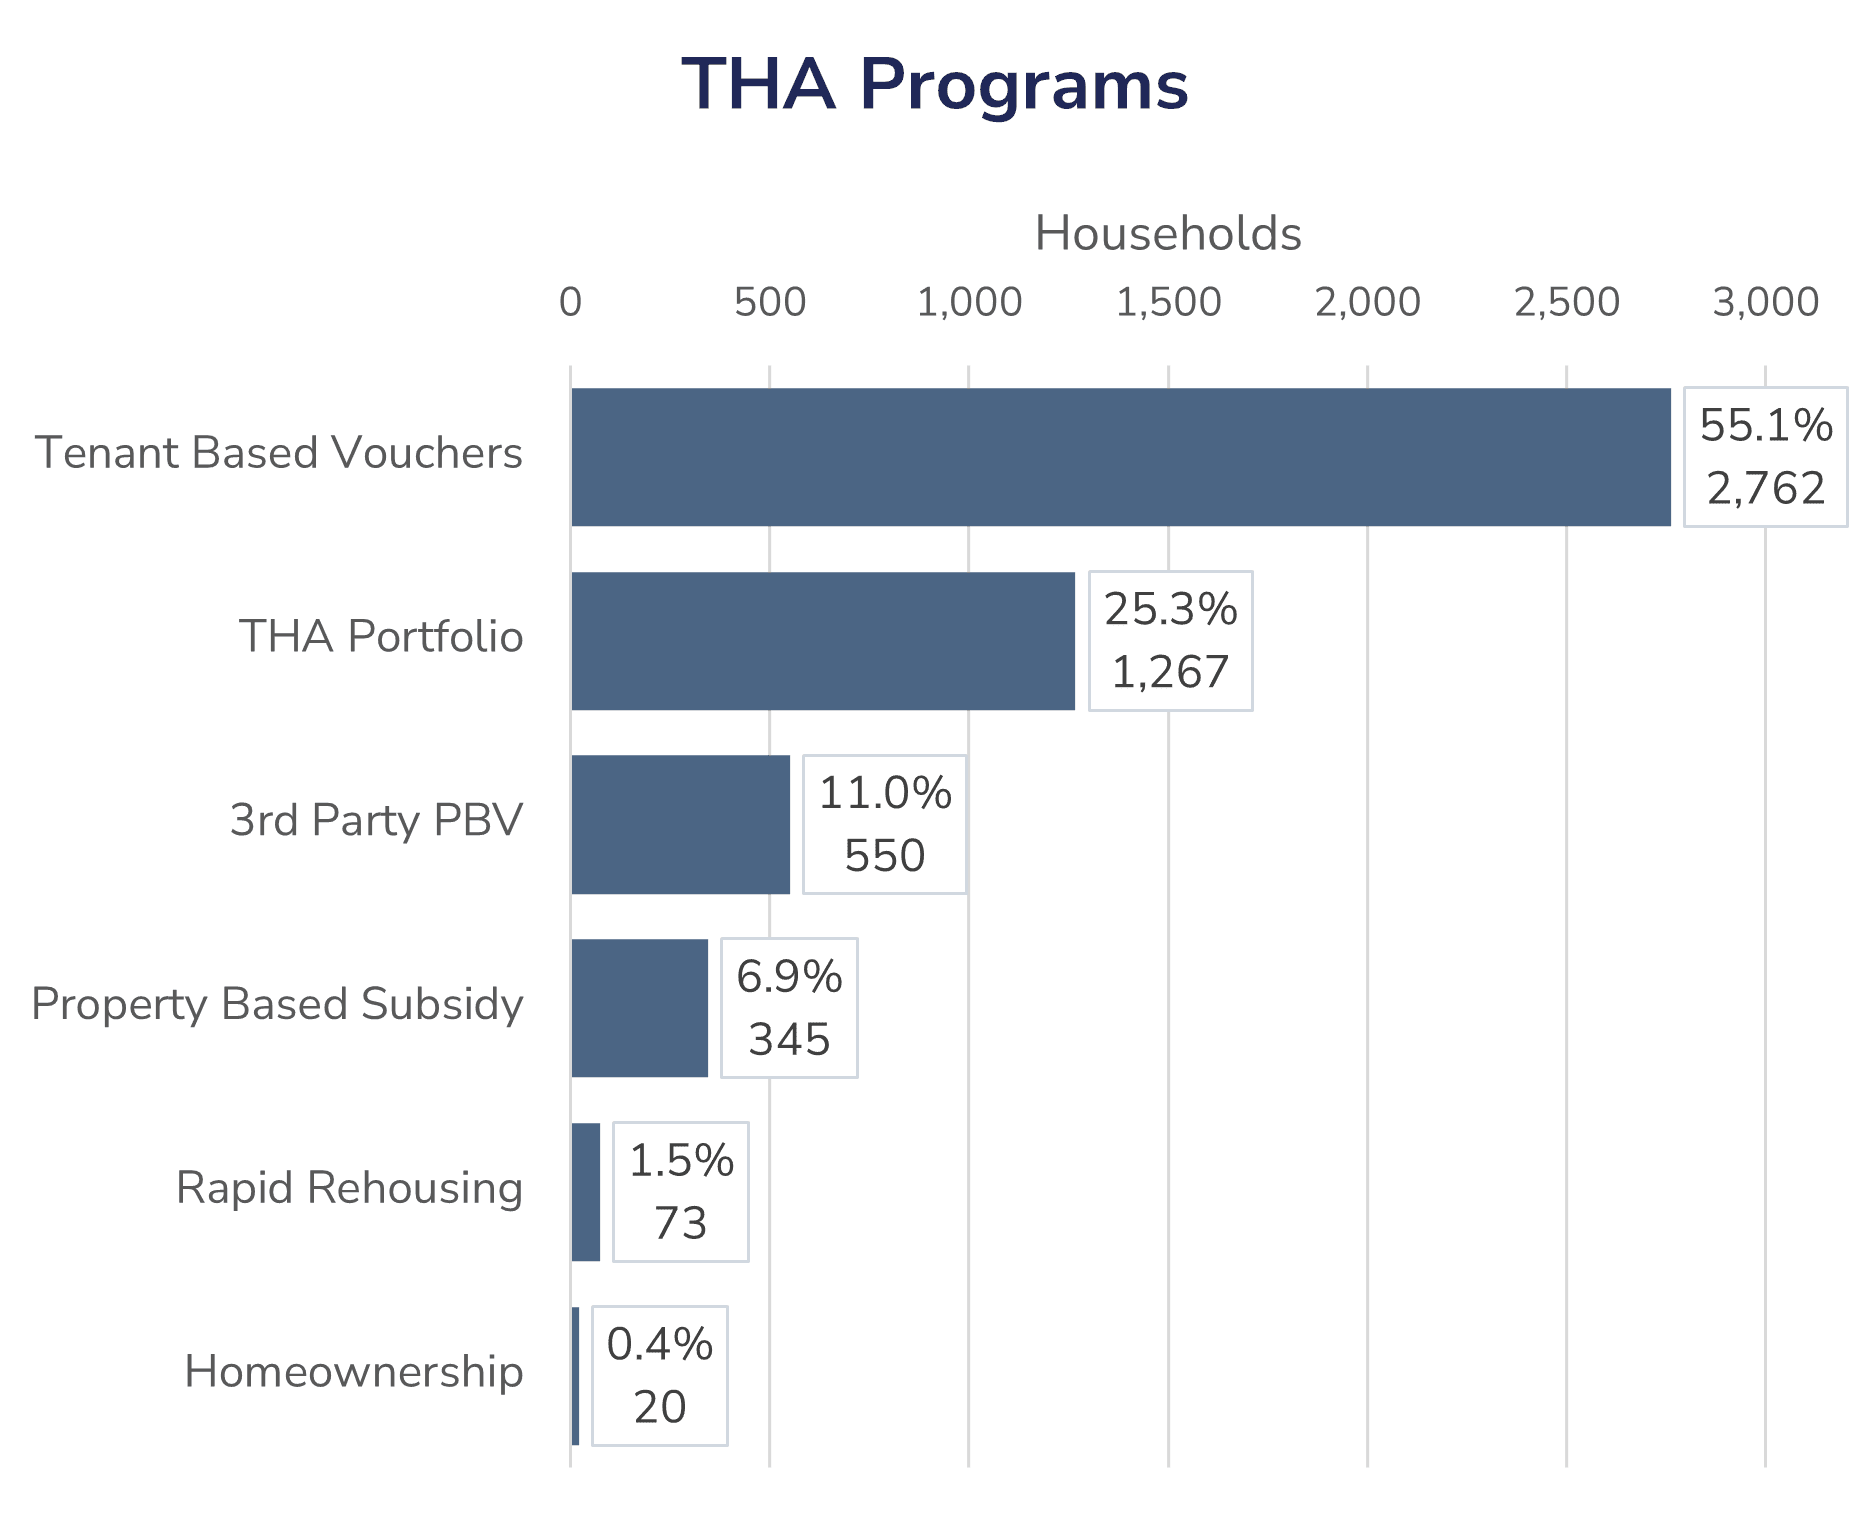
THA serves approximately 5,000 households per month as of June 2023, with the majority (55.1%) receiving voucher subsidies to rent apartments on the private market (Tenant Based Vouchers). 25.3% of households served rent apartments owned by THA in the THA Portfolio.
| Program | Households |
|---|---|
| Tenant Based Vouchers | 2,762 |
| THA Portfolio | 1,267 |
| 3rd Party Project-Based Vouchers | 550 |
| Property Based Subsidy | 345 |
| Rapid Rehousing | 73 |
| Homeownership | 20 |
Household Size
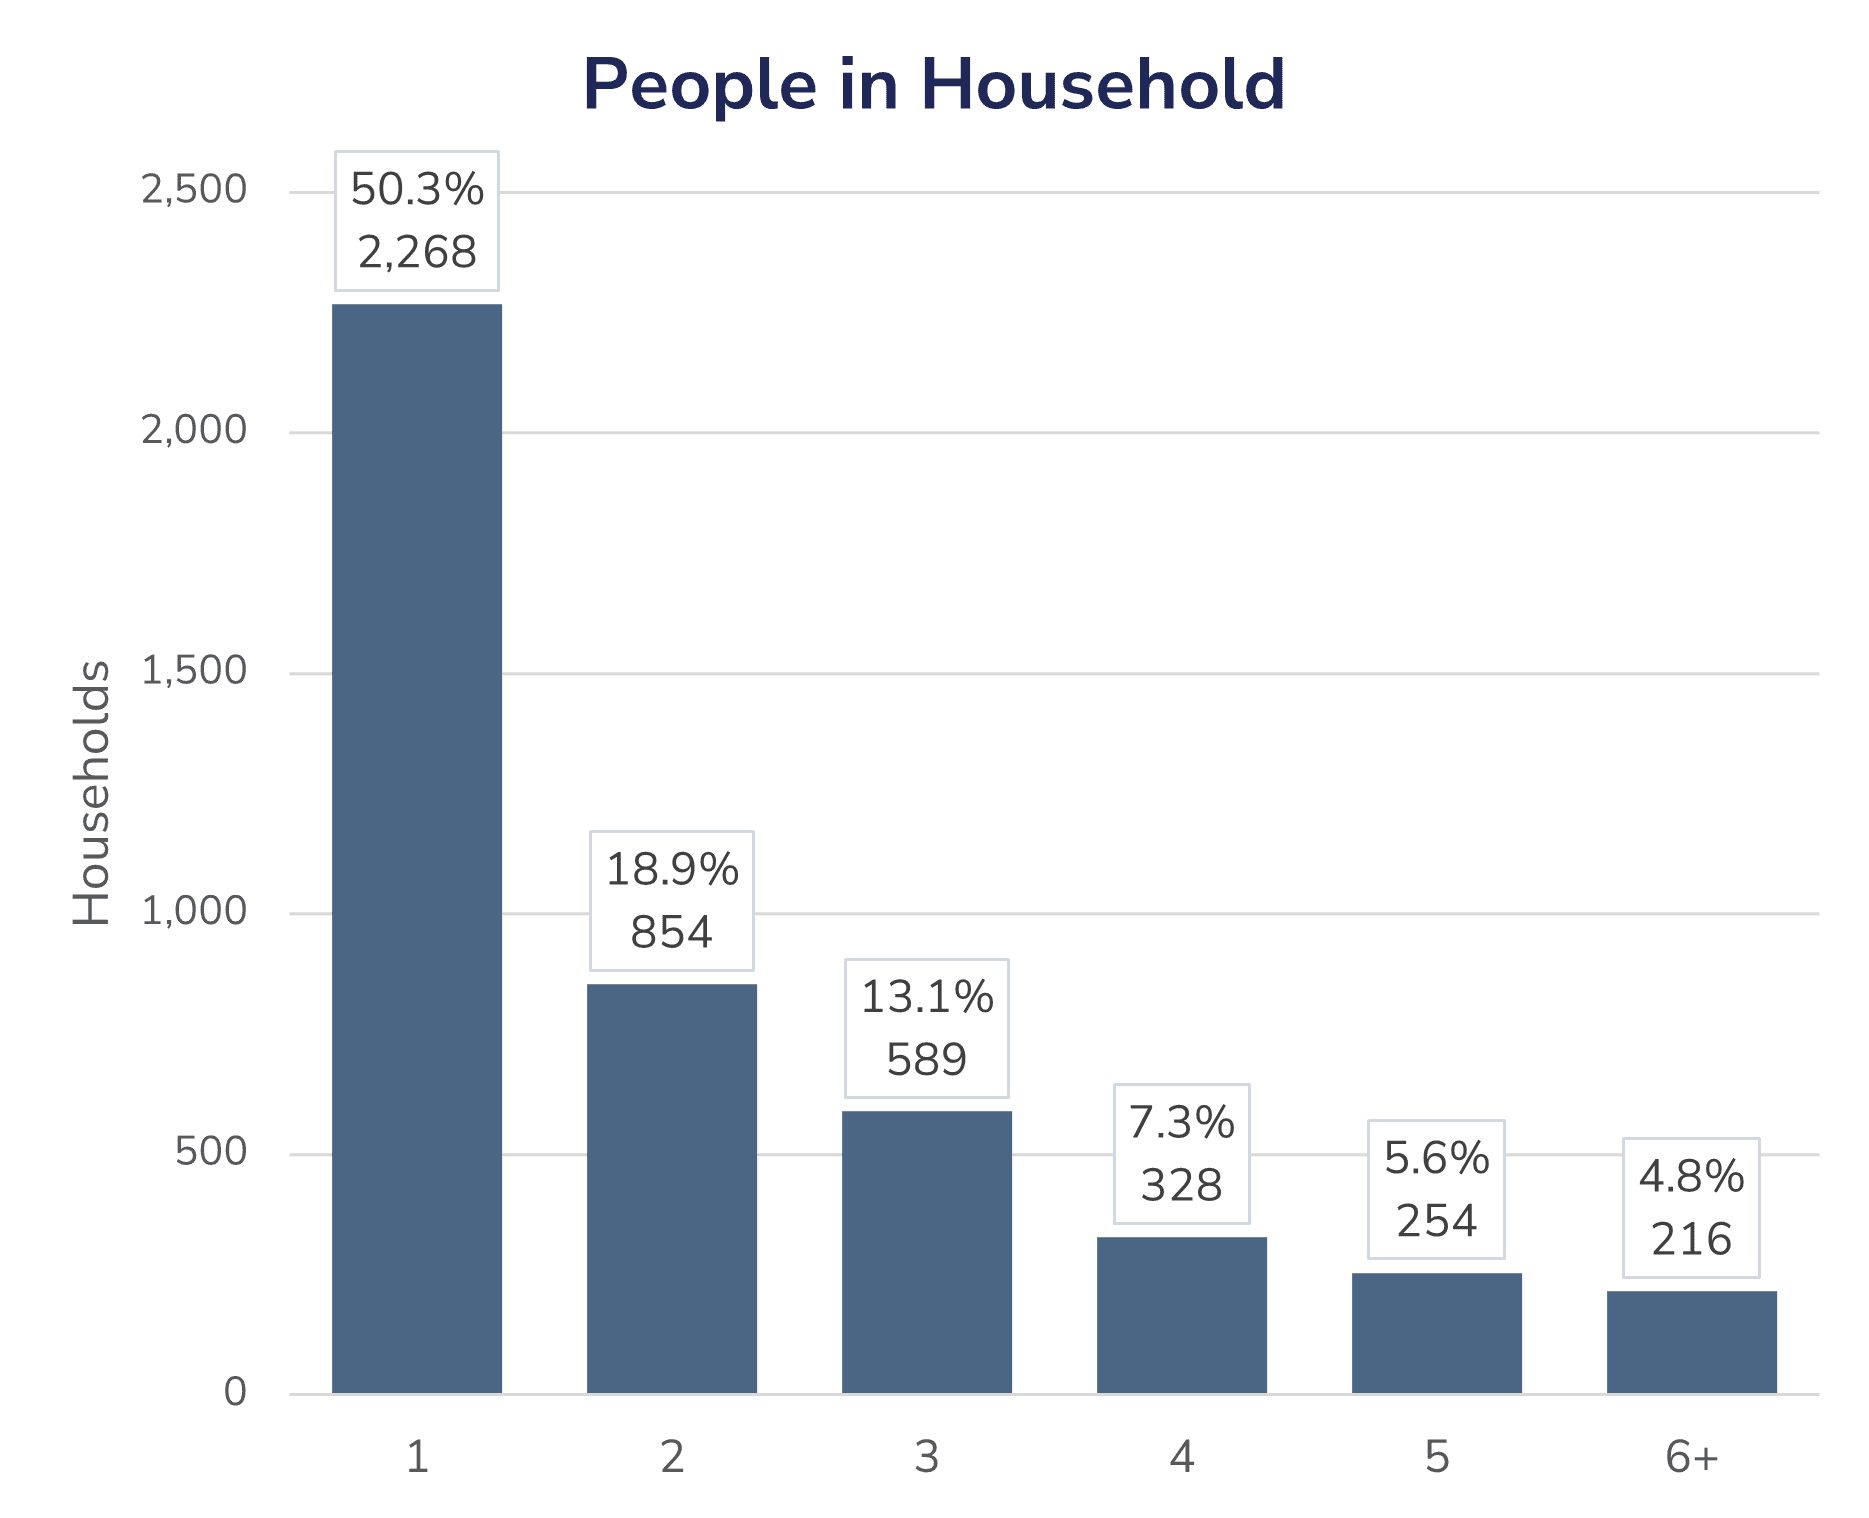
Over half of the households served by THA consist of one individual living by themselves.
| Household Size | Households |
|---|---|
| 1 | 2,268 |
| 2 | 854 |
| 3 | 589 |
| 4 | 328 |
| 5 | 254 |
| 6+ | 216 |
Household Income
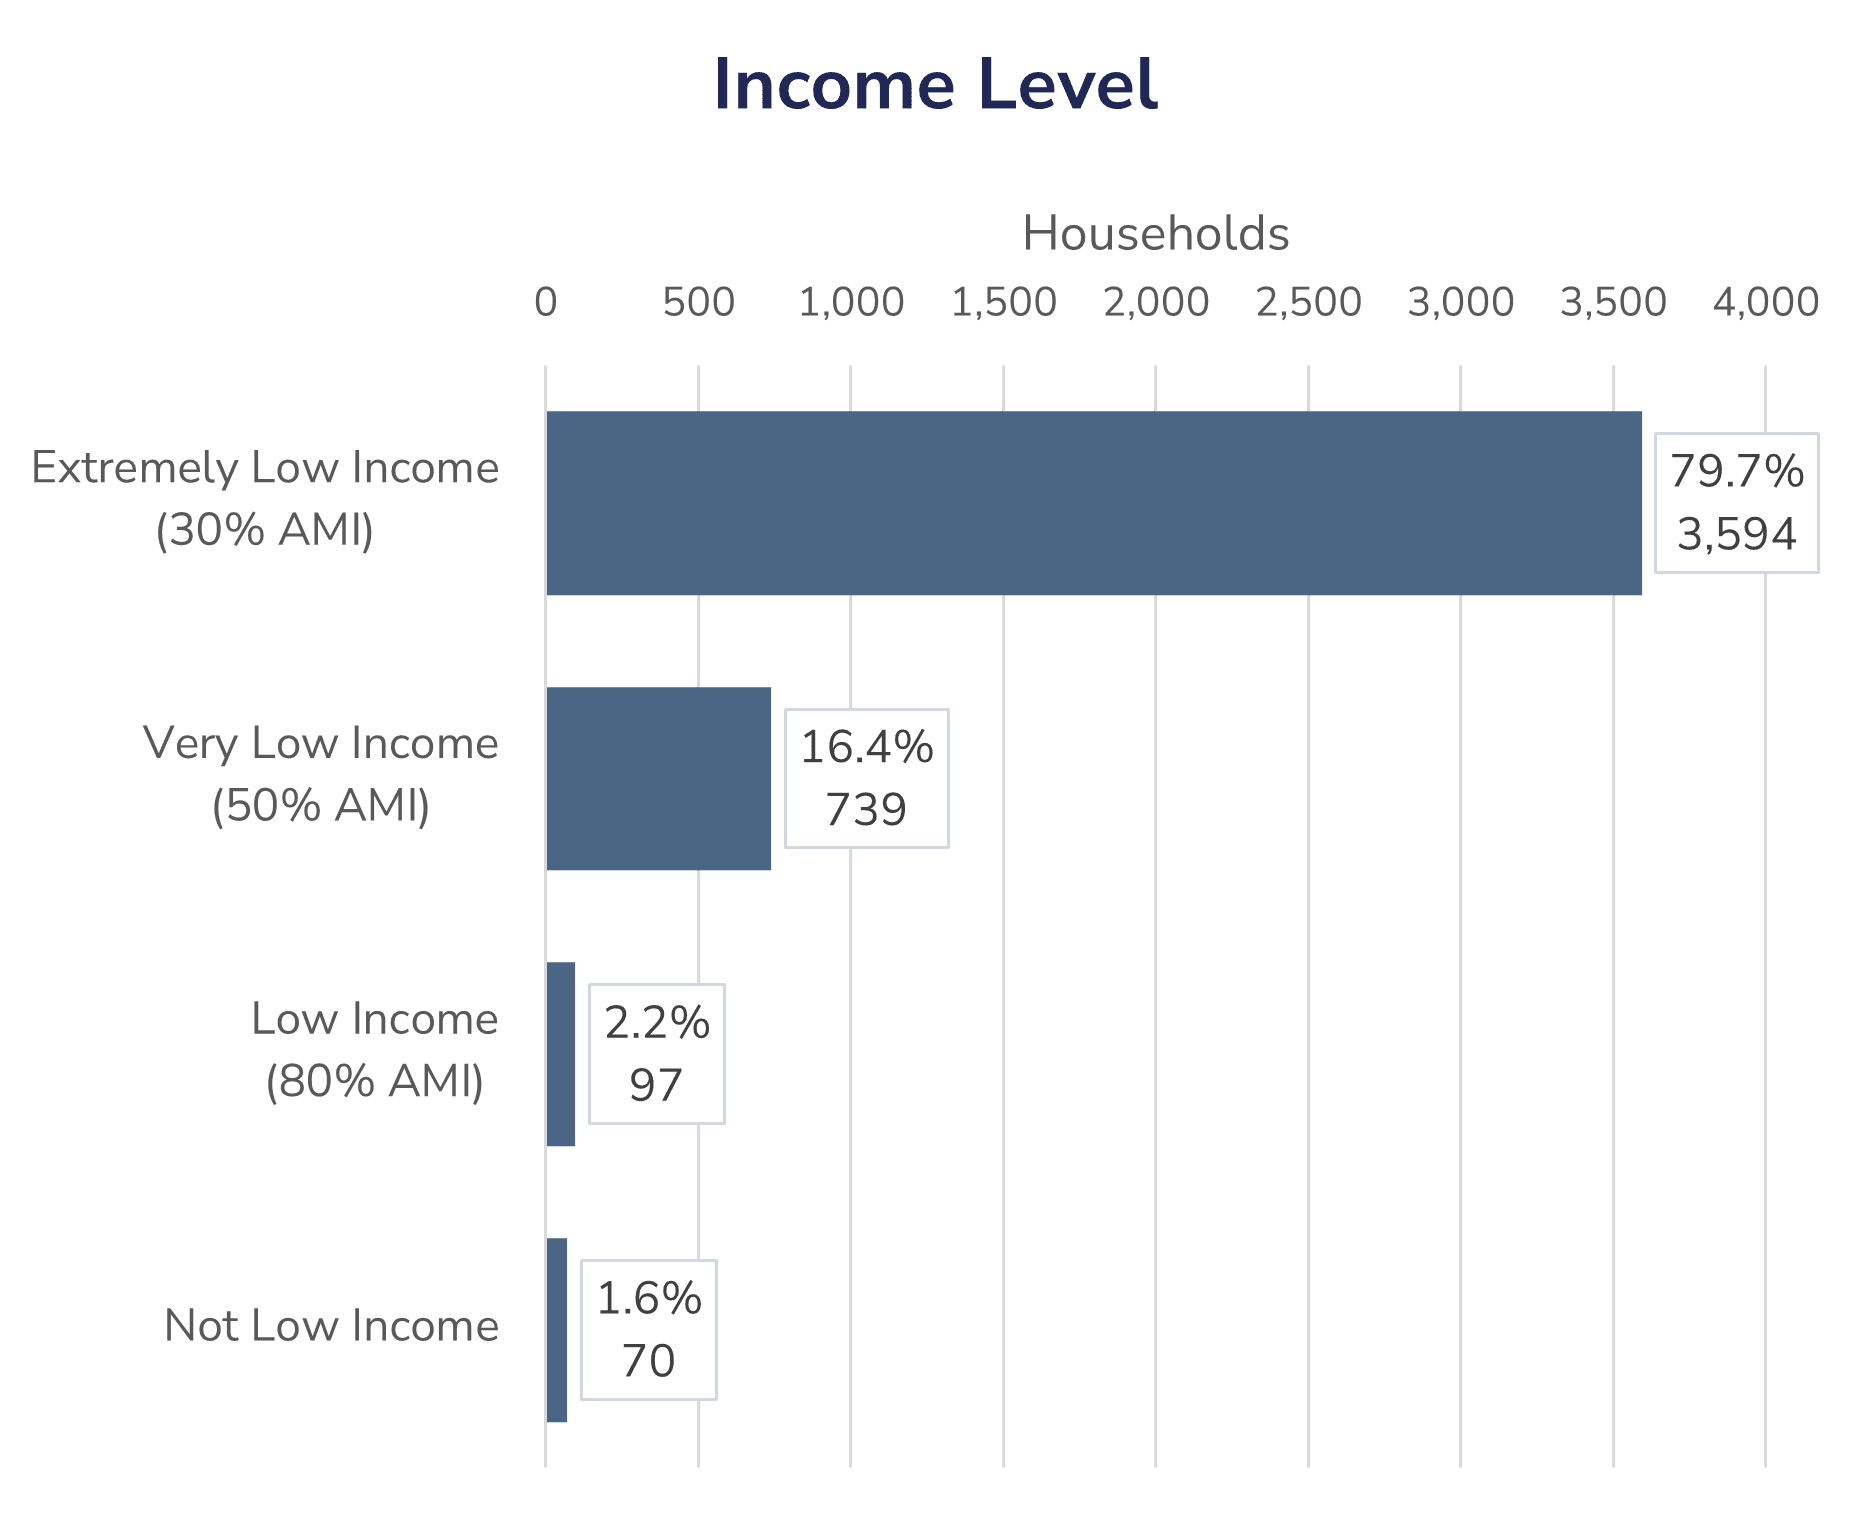
THA serves low-income households, with 79.9% earning less than 30% of the Tacoma Area Median Income (AMI). For a family of four in 2023, that equates to an income of less than $32,250 per year.
| Income Level | Households |
|---|---|
| Extremely Low Income (30% AMI) | 3,594 |
| Very Low Income (50% AMI) | 739 |
| Low Income (80% AMI) | 97 |
| Not Low Income | 70 |
Head of Household Race
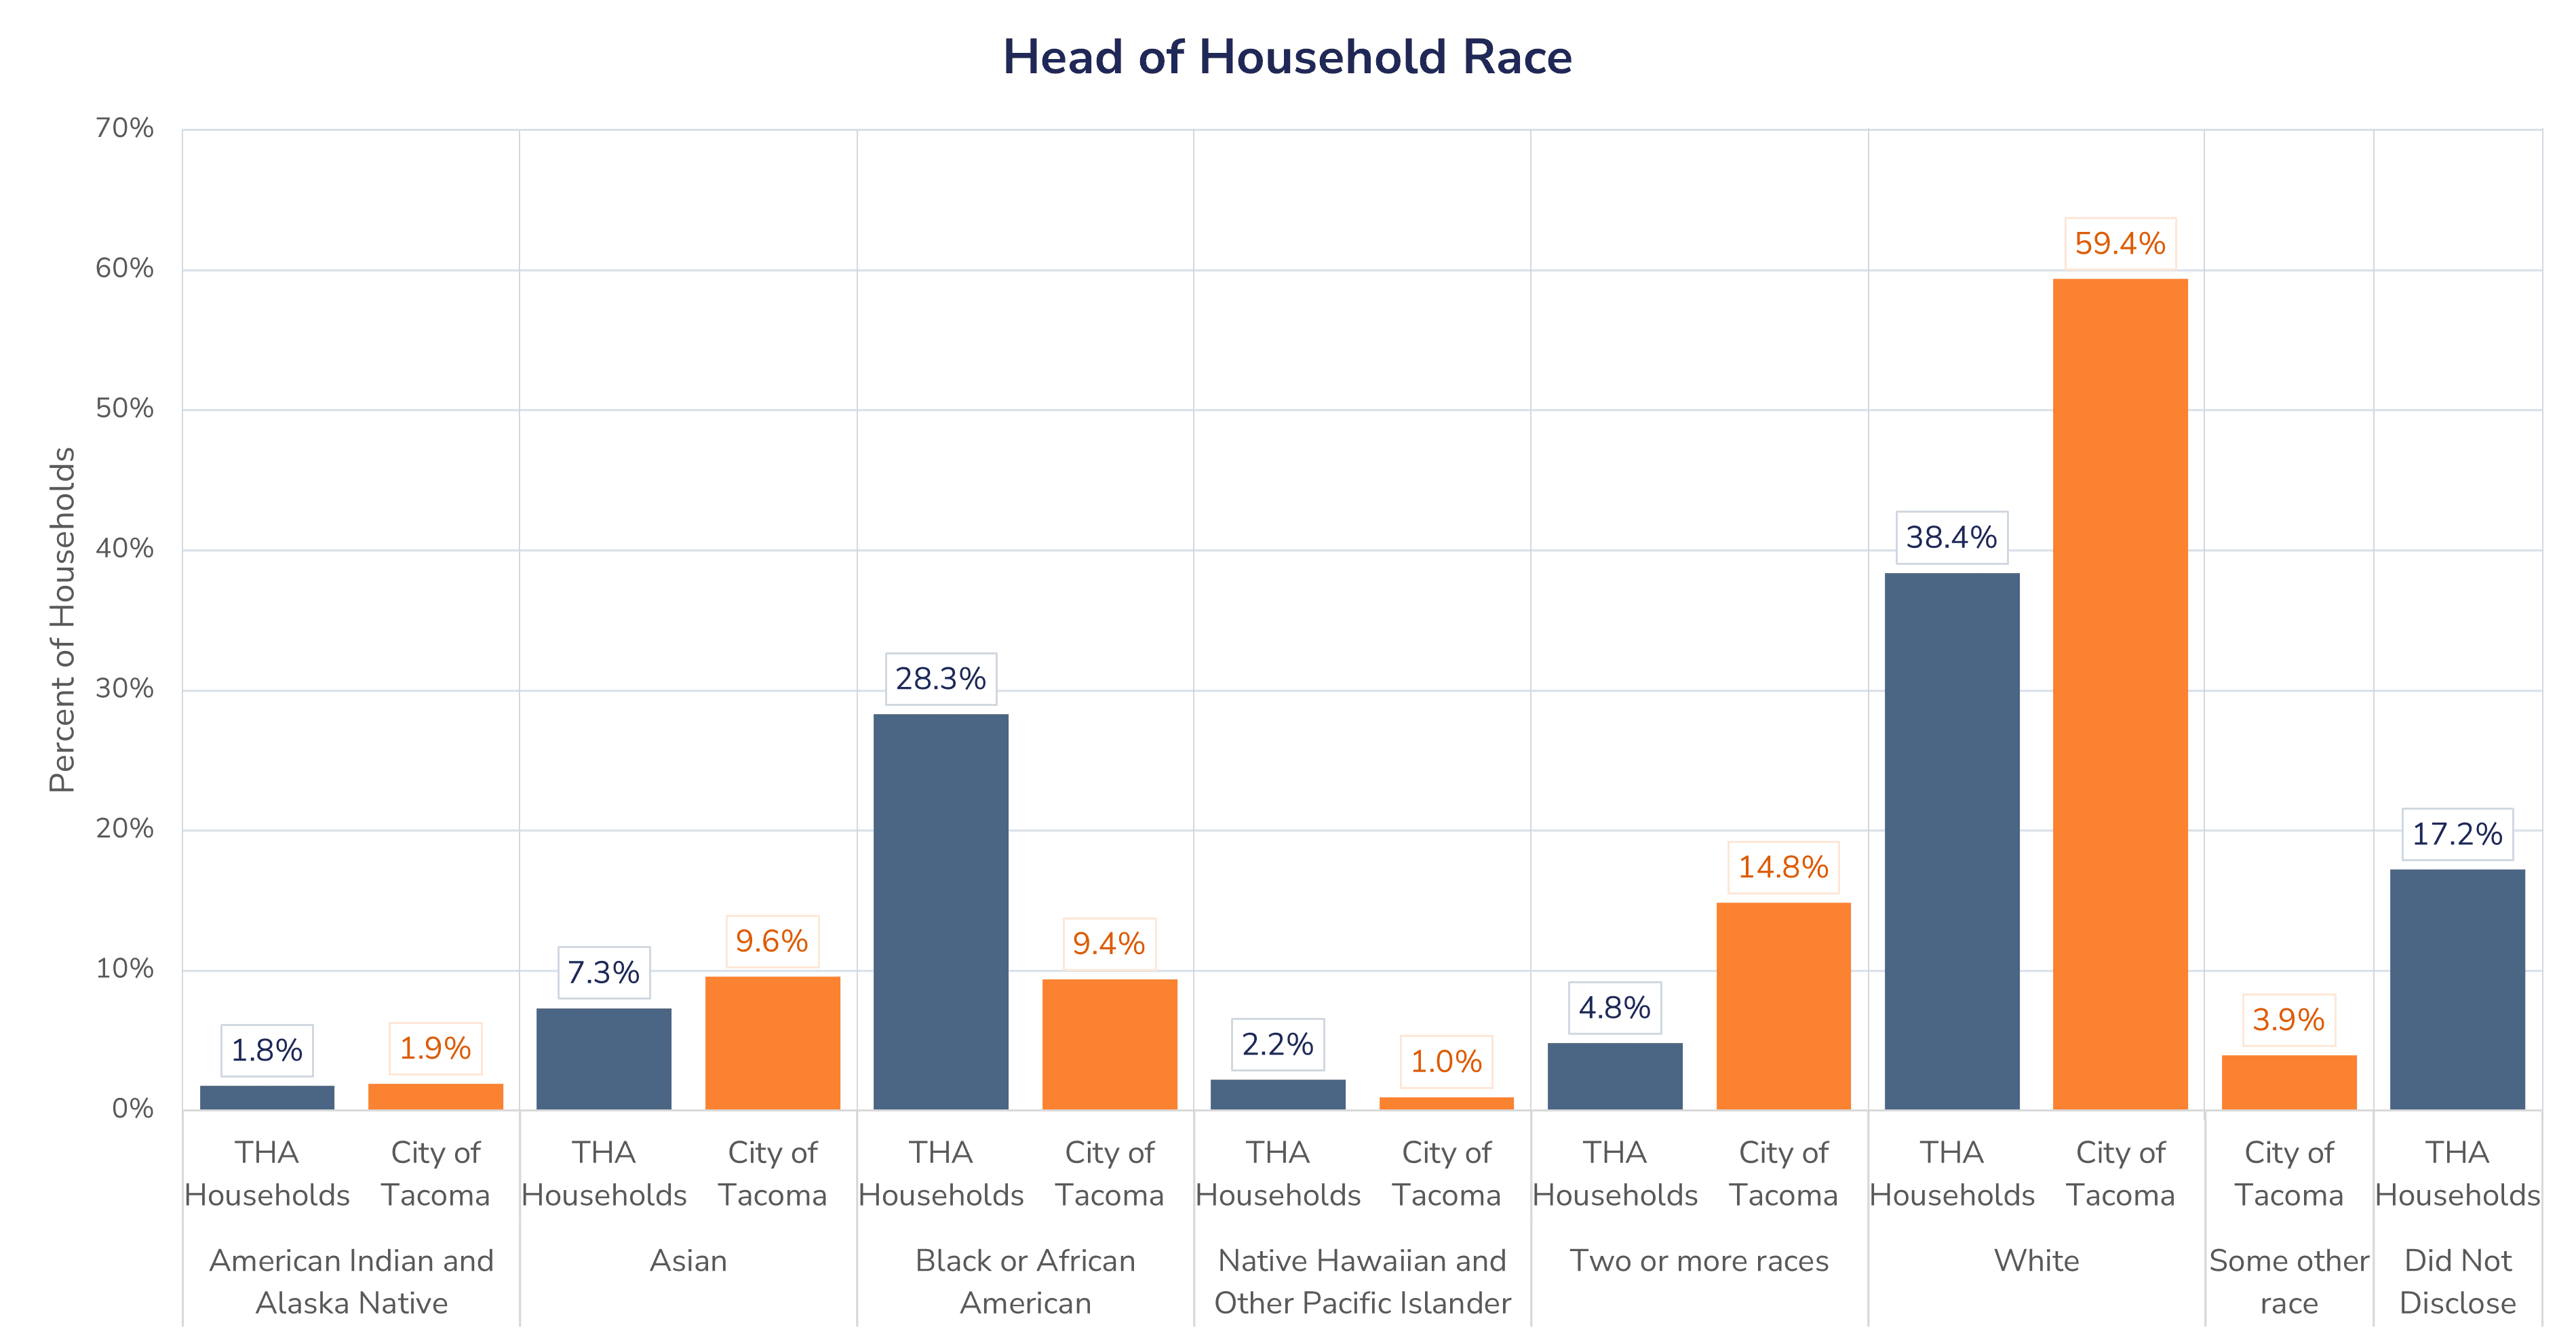
Compared to the racial demographics in City of Tacoma, THA serves a higher proportion of Black or African American (9.4% and 28.3%, respectively) and Native Hawaiian and Other Pacific Islander households (1.0% and 2.2%).
| Race | THA Households | City of Tacoma |
|---|---|---|
| American Indian and Alaska Native | 1.8% | 1.9% |
| Asian | 7.3% | 9.6% |
| Black or African American | 28.3% | 9.4% |
| Native Hawaiian and Other Pacific Islander | 2.2% | 1.0% |
| Two or more races | 4.8% | 14.8% |
| White | 38.4% | 59.4% |
| Some other race | n/a | 3.9% |
| Did Not Disclose | 17.2% | n/a |
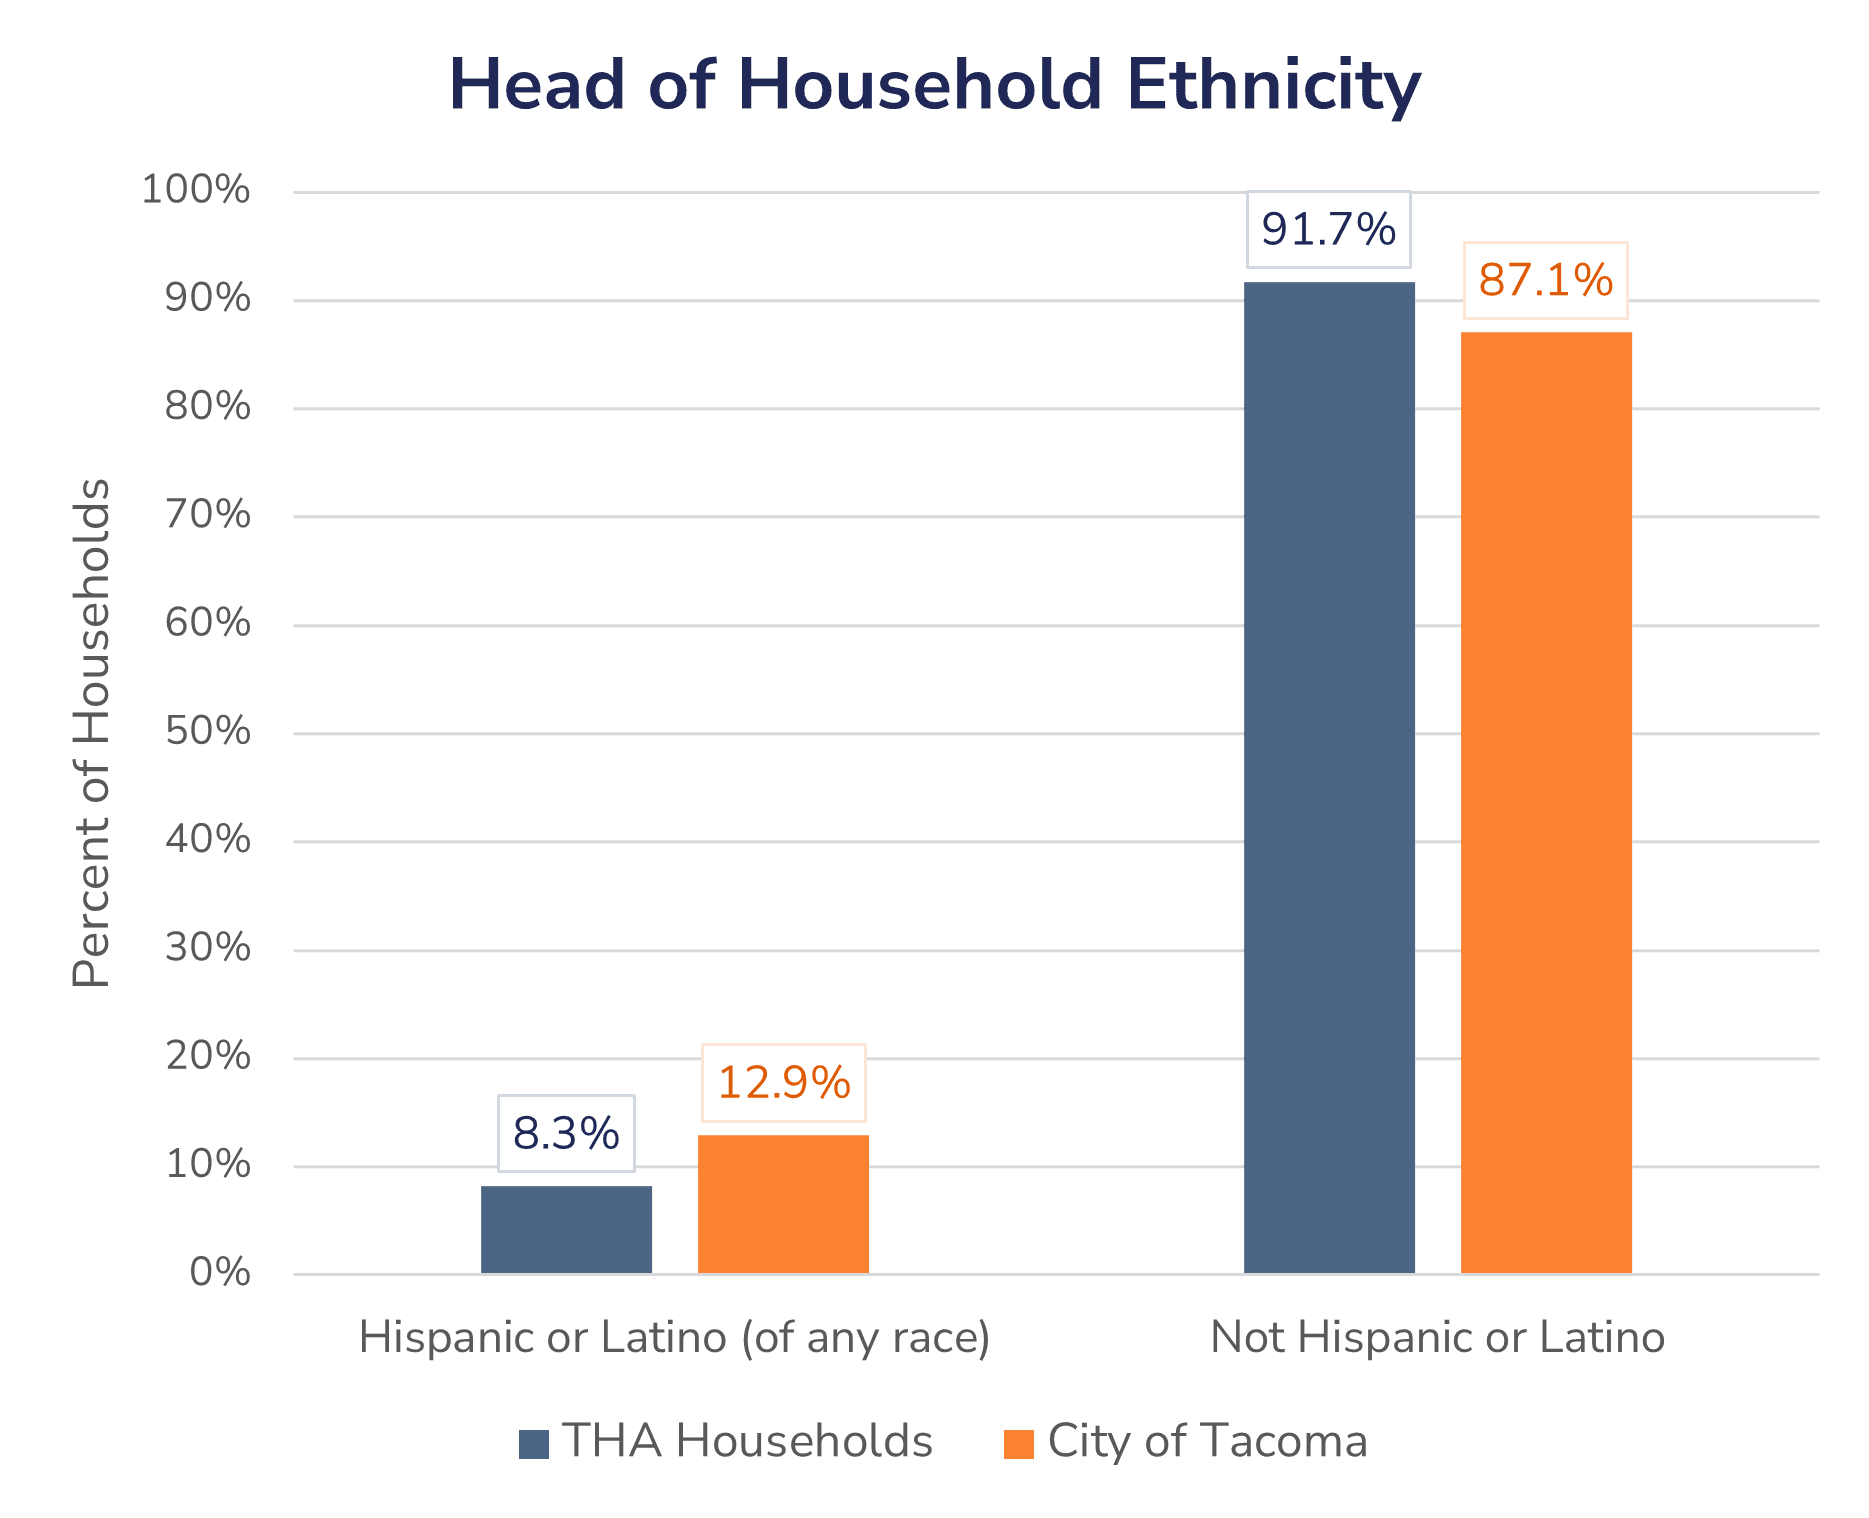
Head of Household Ethnicity
As of June 2023, THA serves a lower proportion of Hispanic or Latino households than City of Tacoma resident demographics (8.3% and 12.9%, respectively).
| Ethnicity | THA Households | City of Tacoma |
|---|---|---|
| Hispanic or Latino (of any race) | 8.3% | 12.9% |
| Not Hispanic or Latino | 91.7% | 87.1% |
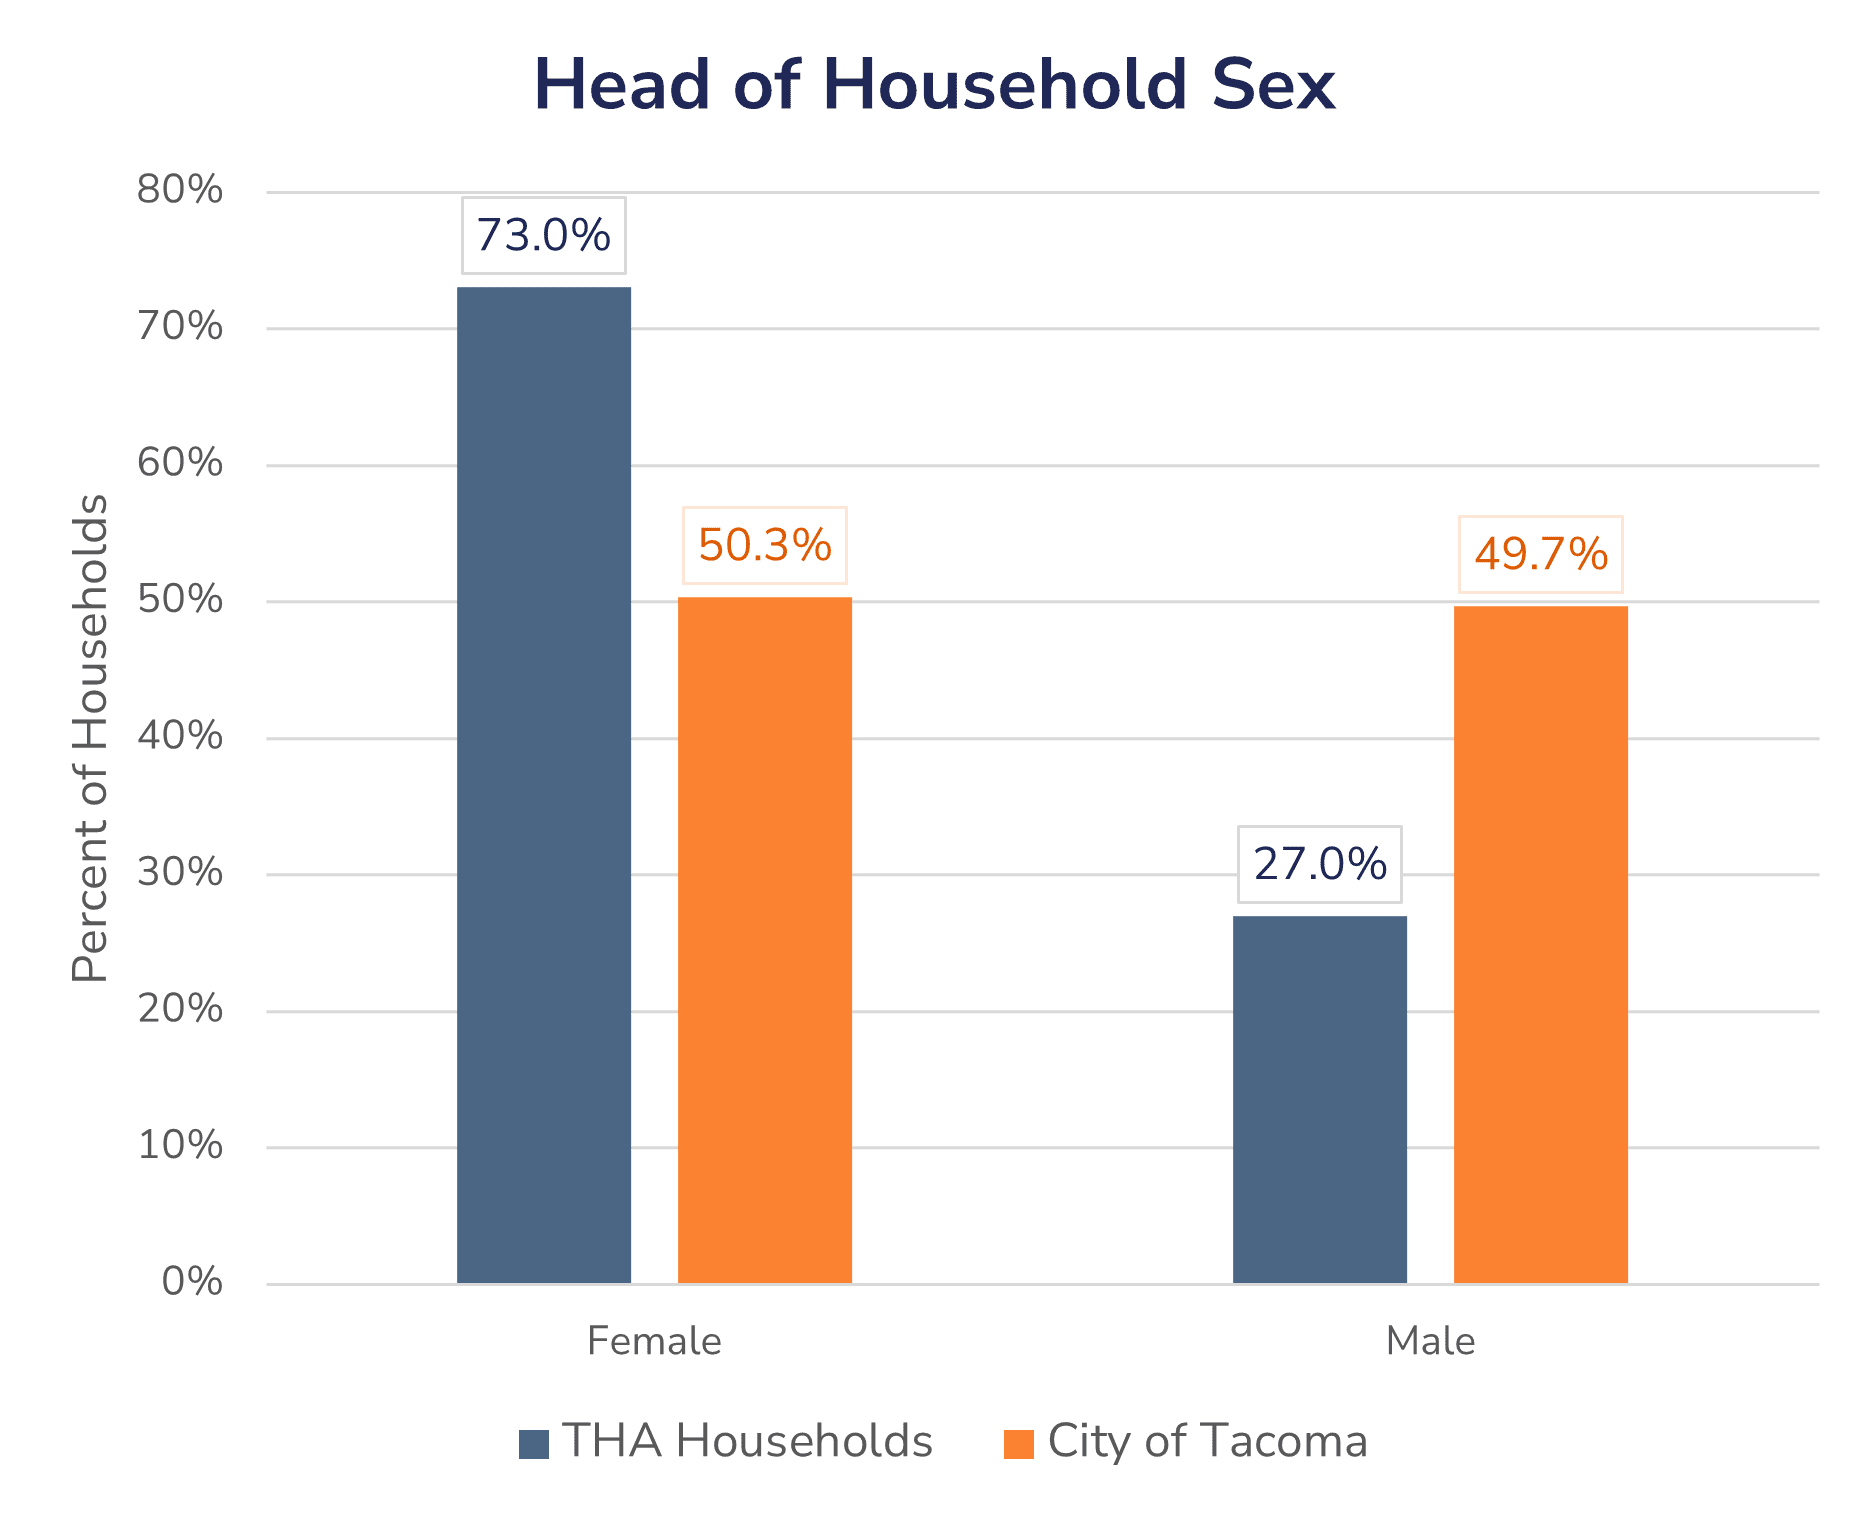
Head of Household Sex
As of June 2023, THA serves a higher proportion of Female-headed households than City of Tacoma resident demographics (73.0% and 50.3%, resp.).
| Sex | THA Households | City of Tacoma |
|---|---|---|
| Female | 73.0% | 50.3% |
| Male | 27.0% | 49.7% |
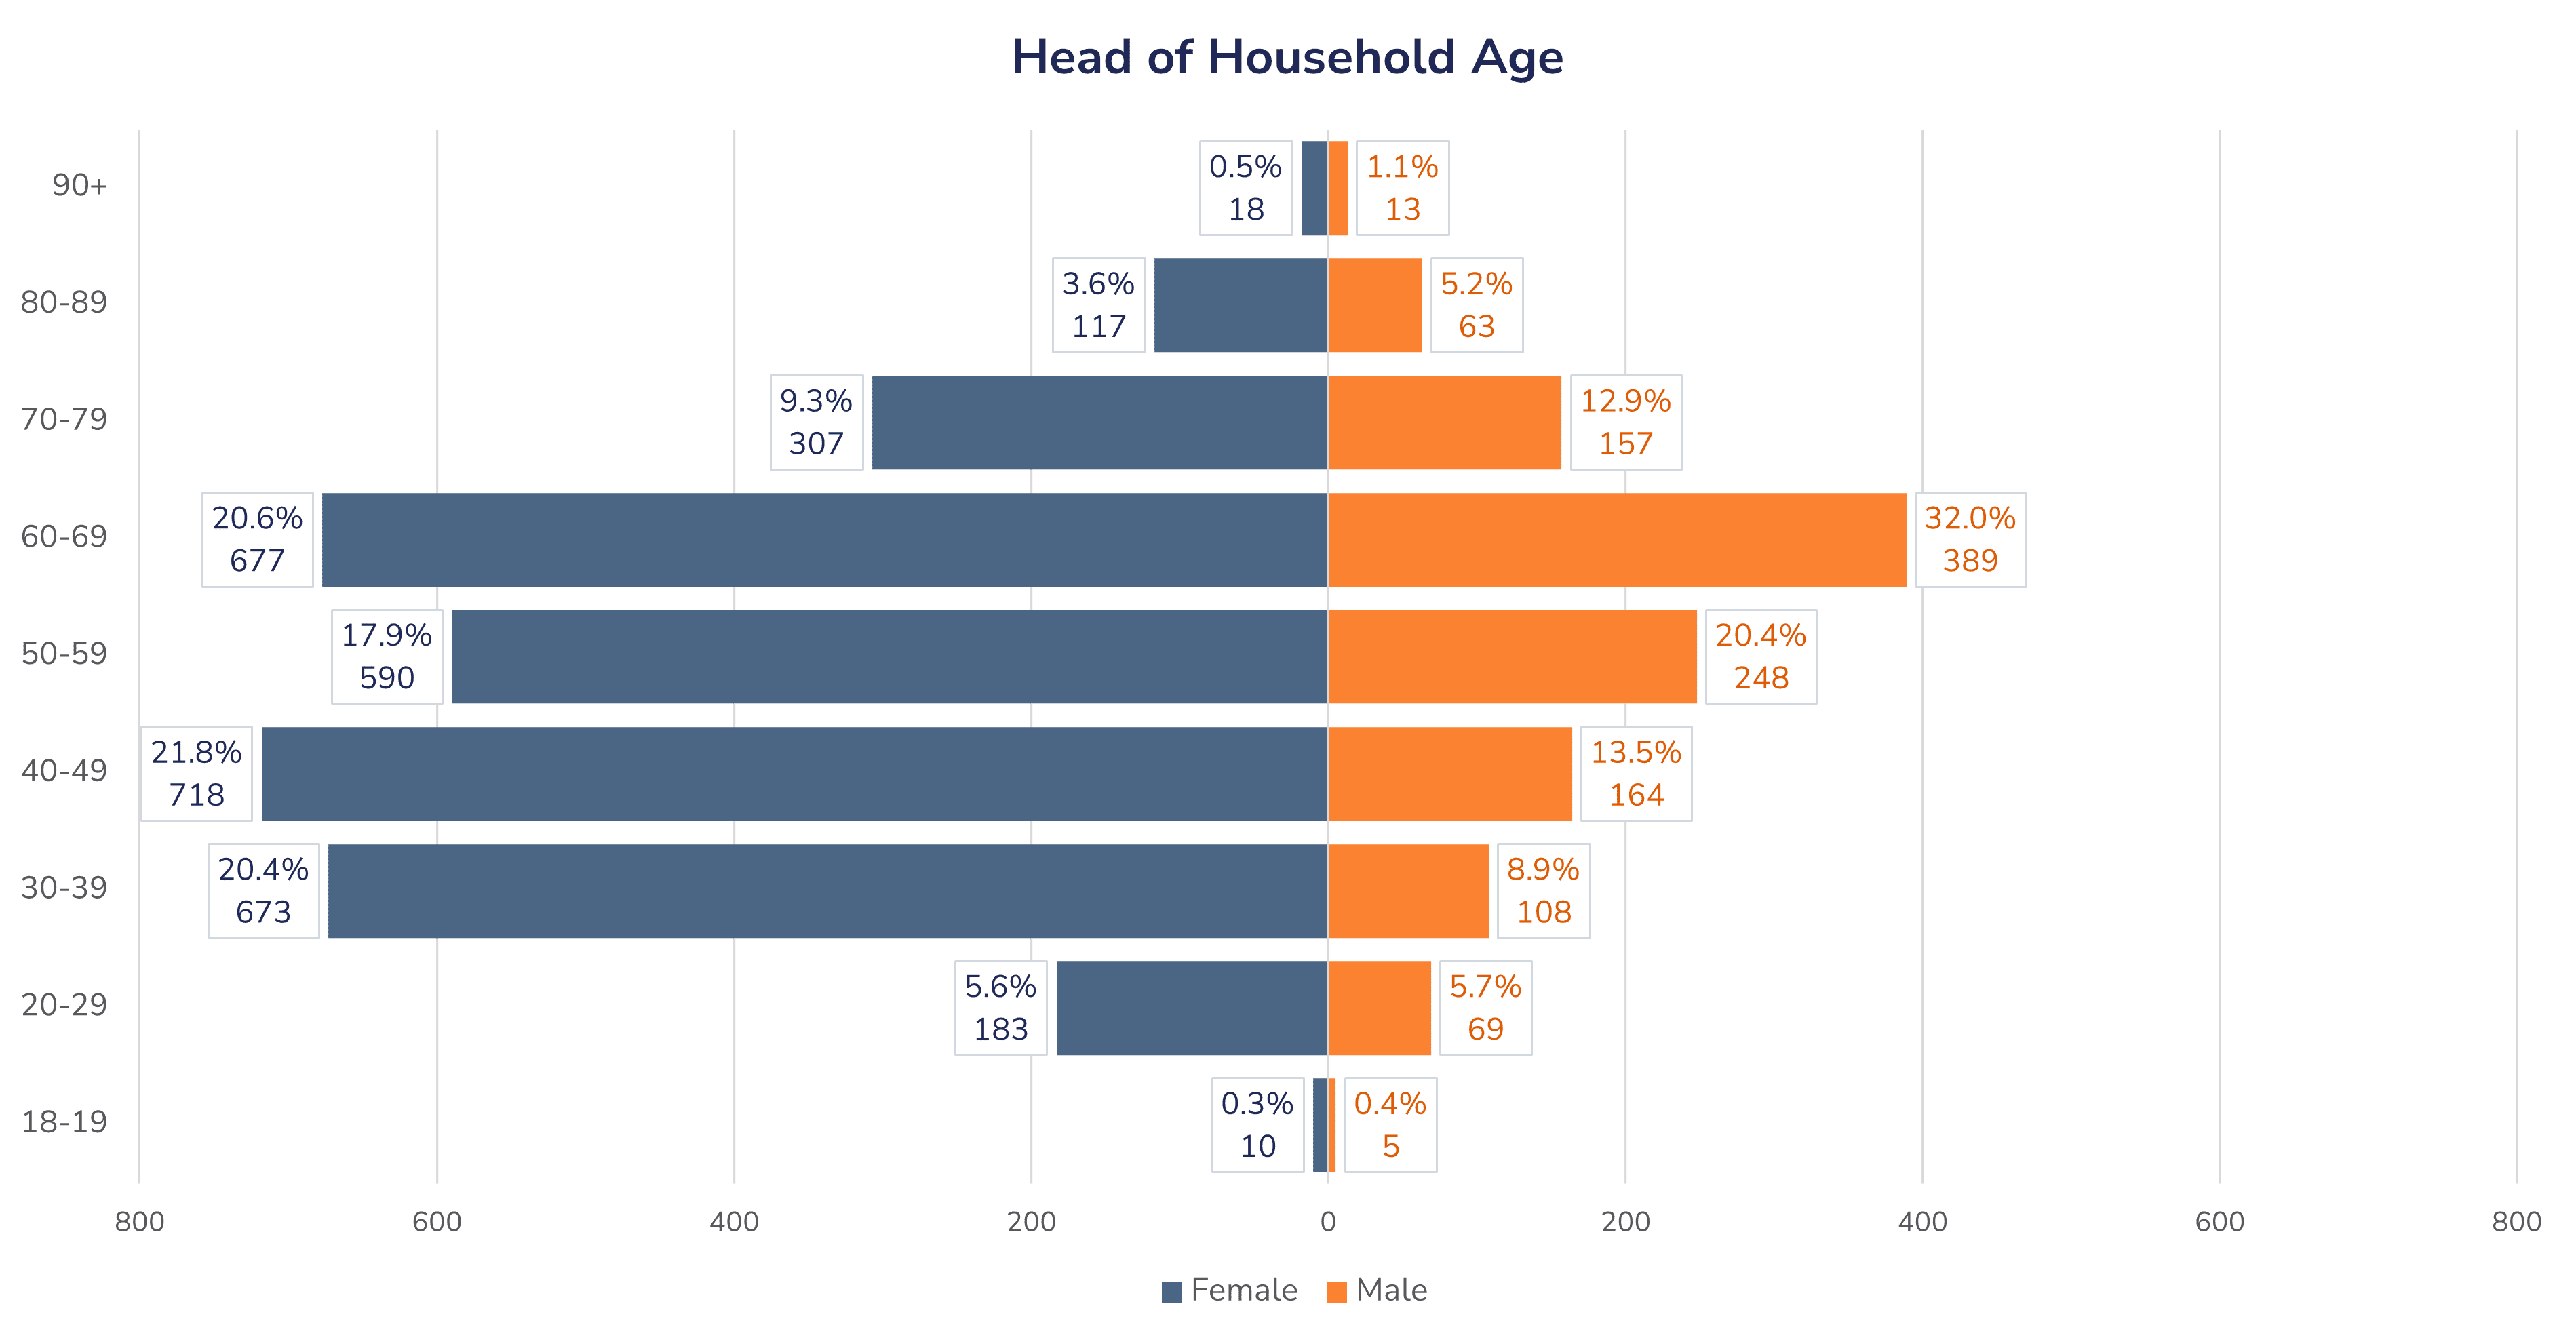
Age of Head of Household by Sex
The age of household heads that THA serves differs by gender. Both female and male heads in the 60–69 age category were among the most prevalent for each sex (677 and 389 households, respectively). However, female heads of household tended to be almost evenly distributed from 30–69 years of age, while male household heads are far more likely to be in the 60–69 age group.
Female heads of household outnumbered male-led households in every age category, with especially wide margins for younger age groups.
| Age | Female | Male |
|---|---|---|
| 18-19 | 10 | 5 |
| 20-29 | 183 | 69 |
| 30-39 | 673 | 108 |
| 40-49 | 718 | 164 |
| 50-59 | 590 | 248 |
| 60-69 | 677 | 389 |
| 70-79 | 307 | 157 |
| 80-89 | 117 | 63 |
| 90+ | 18 | 13 |
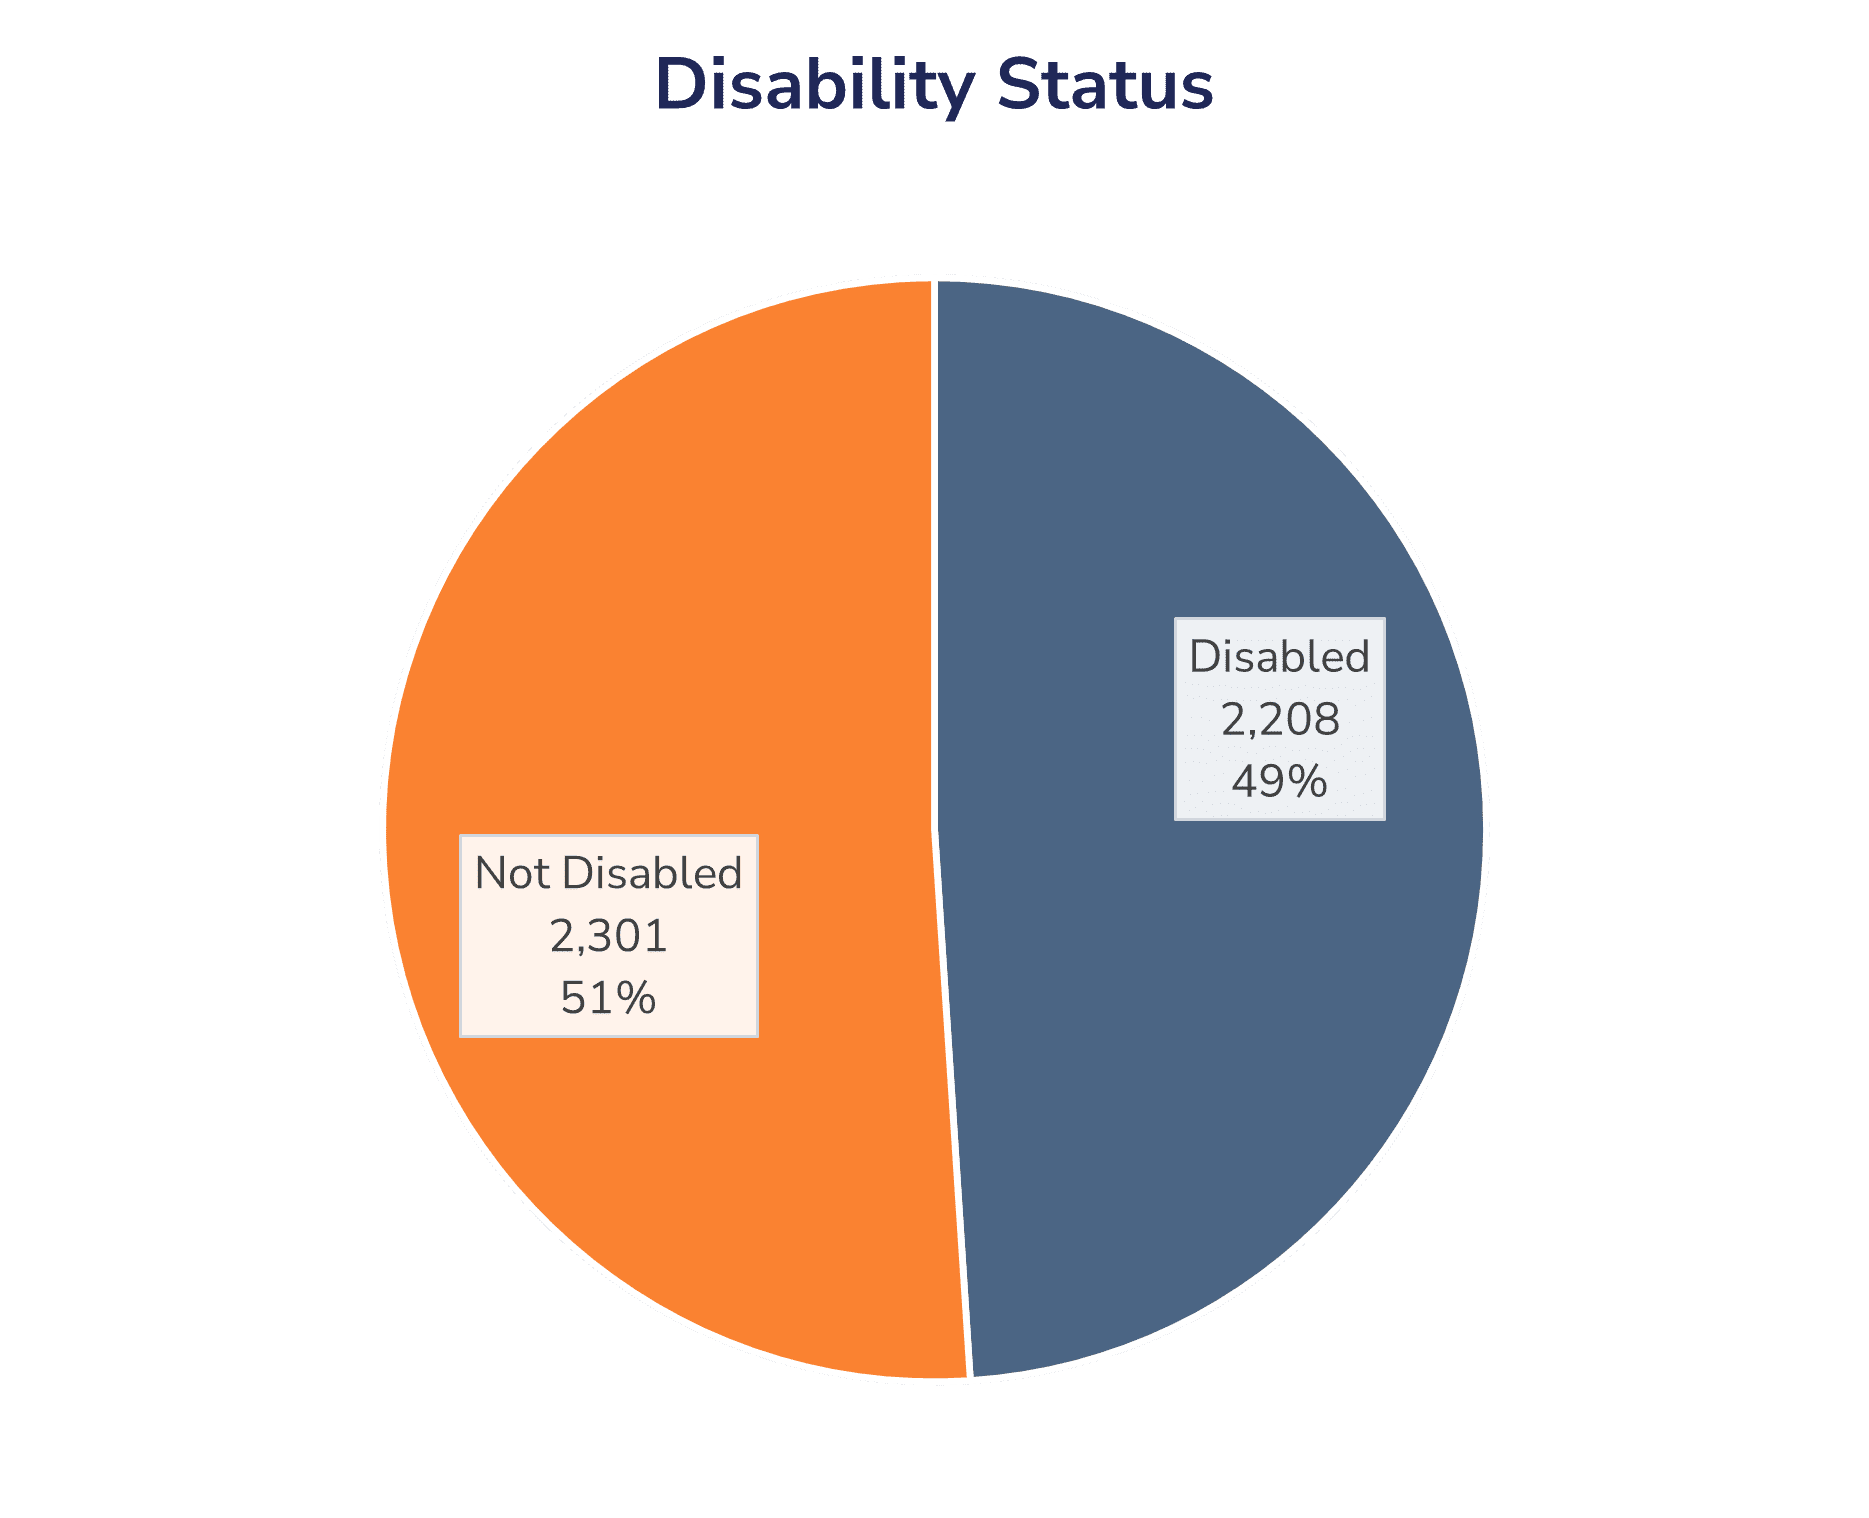
Head of Household Disability Status
As of June 2023, THA serves nearly equal proportions of households with a disabled or non-disabled head (49.0% and 51.0%, resp.).
| Disability Status | Heads of Household |
|---|---|
| Disabled | 2,208 |
| Not Disabled | 2,301 |
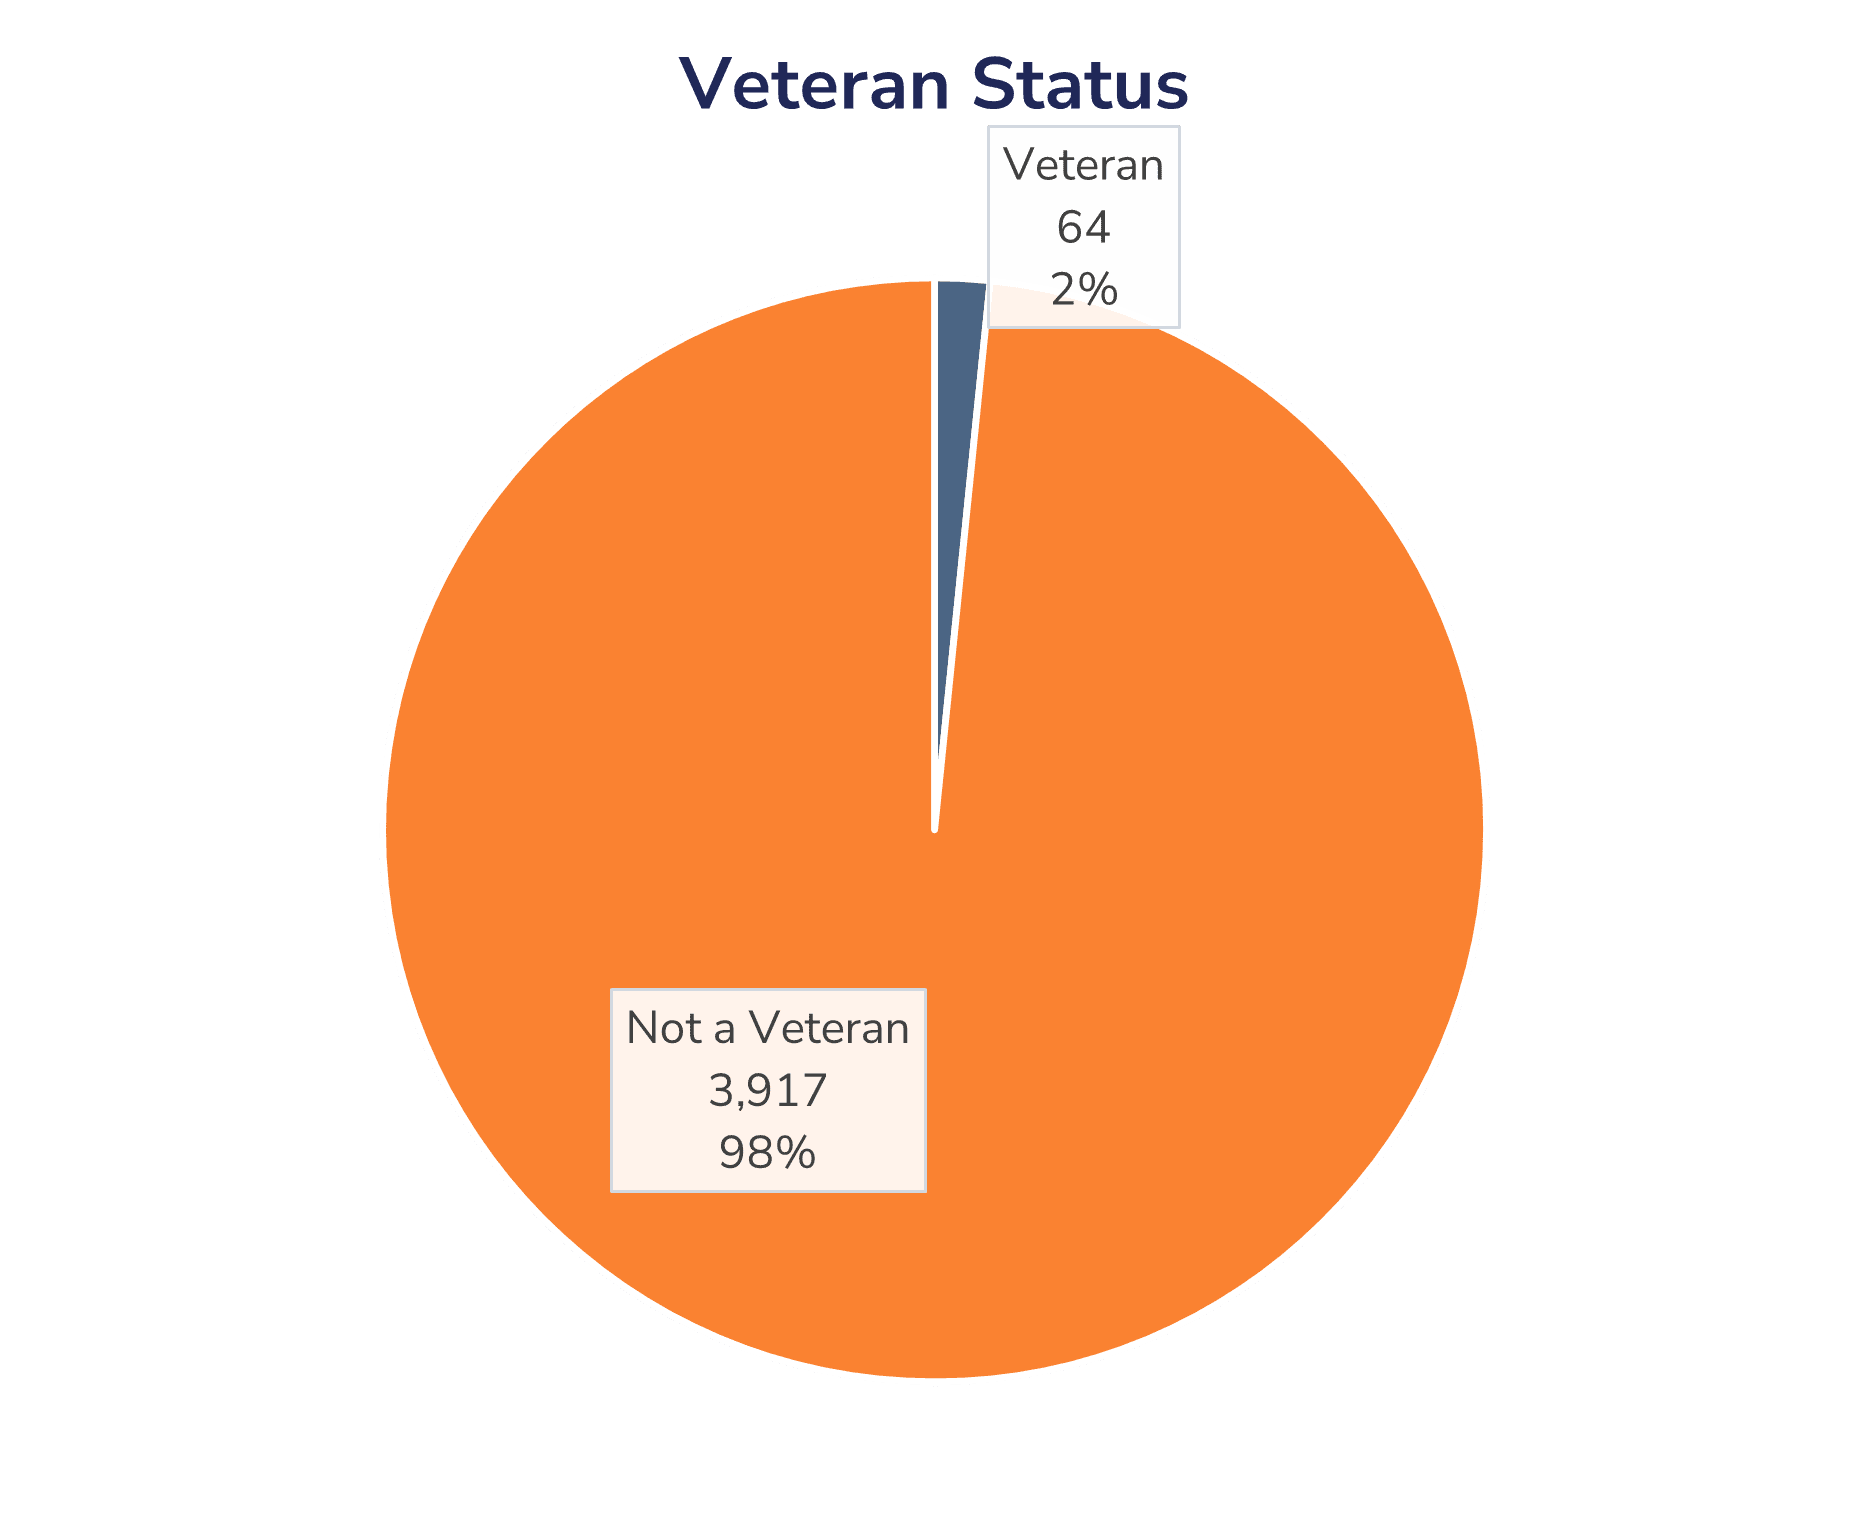
Head of Household Veteran Status
As of June 2023, 2.2% of the households that THA serves are headed by military veterans.
| Veteran Status | Heads of Household |
|---|---|
| Veteran | 64 |
| Not a Veteran | 3,917 |
City of Tacoma data from the 2021 American Community Survey 1-year Estimate